Accelerate IT operations with AI-driven Automation
Automation in IT operations enable agility, resilience, and operational excellence, paving the way for organizations to adapt swiftly to changing environments, deliver superior services, and achieve sustainable success in today's dynamic digital landscape.
Driving Innovation with Next-gen Application Management
Next-generation application management fueled by AIOps is revolutionizing how organizations monitor performance, modernize applications, and manage the entire application lifecycle.
AI-powered Analytics: Transforming Data into Actionable Insights
AIOps and analytics foster a culture of continuous improvement by providing organizations with actionable intelligence to optimize workflows, enhance service quality, and align IT operations with business goals.
Imagine walking into a library with millions of books but no catalog, no index, and no librarian. You know the answers are there, but finding them is slow, painful, and often inconclusive. That is exactly how many enterprises operate today – awash in data yet starving for insight.
Modern organizations are rich in data but poor in knowledge. Business-critical information is locked away in departmental silos, outdated spreadsheets, and disconnected applications. This fragmentation does not just slow decision-making; it threatens competitiveness in a world where speed and intelligence are paramount.
What if data could not only be stored but also understood in context? What if systems could reveal relationships, patterns, and opportunities hidden across business domains? That is precisely what knowledge graphs offer.
According to Gartner, knowledge graphs are “graph-based data structures that capture the semantics and relationships among data to support enhanced context, insight, and data-driven decision-making.” By 2026, Gartner predicts that enterprises using semantic and graph-based approaches will reduce artificial intelligence technical debt by 75% compared to those relying on traditional architectures.
These semantic, interconnected structures are quickly becoming foundational to AI, digital transformation, and intelligent decision-making. In this blog, we explore what knowledge graphs are, how they work, their core characteristics, and how leading organizations are using them to unlock unprecedented value.
A recent survey found that 48% of M&A professionals are now using AI in their due diligence processes, a substantial increase from just 20% in 2018, highlighting the growing recognition of AI’s potential to transform M&A practices.
What is a Knowledge Graph?
A knowledge graph (KG) is a machine-readable, semantically rich data structure that models real-world entities — such as people, products, services, or digital assets — and the relationships between them. It organizes this information in the form of nodes (entities) and edges (relationships), building a web of context rather than isolated records. KGs represent both physical and digital knowledge, linking disparate data sources to reveal how things are connected, not just what exists.
First introduced at scale by Google to enhance search by focusing on “things, not strings,” knowledge graphs have since matured into strategic assets for modern enterprises. Today, they drive a wide range of capabilities — from intelligent automation and real-time decisioning to enriching AI models with context-aware insights. More than just revealing what your data contains, a knowledge graph uncovers the how, why, and what’s next — transforming raw information into actionable intelligence.
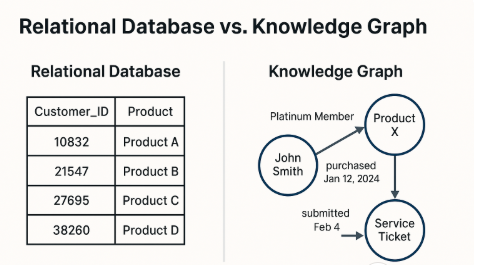
What makes KGs especially compelling is their ability to link data across silos using meaningful relationships and surface it in a format that both humans and machines can interpret. In contrast to relational databases that store tabular data with limited relational depth, KGs provide a dynamic, flexible way to explore the interconnected nature of business entities.
Example:
- Traditional view: Customer_ID = 10832
- Knowledge graph view: “John Smith is a Platinum Member who purchased Product X on January 12, 2024, and submitted a service ticket on February 4”
Related Content: How to Build a Knowledge Graph: 10 Simple Steps
How Knowledge Graphs Works
At the heart of a knowledge graph is the concept of a triple — a combination of subject, predicate, and object that expresses a single fact. For example:
“Employee123” — “reportsTo” — “Manager456”
These triples form a semantic graph, enabling complex queries such as:
“Show all customers in the EU who purchased Product Z and currently have open support tickets.”
A relational database might require multiple tables joined to answer this; a knowledge graph can deliver it with a single graph traversal.
Graph Construction Essentials
Creating an enterprise-ready knowledge graph involves several key components:
- Data Ingestion Pipelines
Integration of data from sources such as relational databases, APIs, spreadsheets, documents, and real-time systems.
- Entity Recognition and Linking
Using natural language processing and machine learning to identify meaningful concepts and unify them across sources.
- Ontology Frameworks
Domain-specific models that define classes (e.g., customer, invoice, asset) and the relationships that can exist between them.
- Reasoning Engines
Algorithms that infer new knowledge by applying logical rules and constraints — such as deriving that a customer is “at risk” based on interactions and purchase patterns.
The result is a continuously evolving, machine-readable graph that not only reflects reality but also anticipates it. As organizations accumulate more diverse data, knowledge graphs offer a scalable, intelligent way to bring everything together — unlocking insight from complexity.
Key Characteristics of Knowledge Graphs
So, what makes knowledge graphs stand out in a world filled with data tools and technologies? The secret lies in how they mimic the way we, as humans, understand the world — through relationships, context, and meaning.
Here’s what gives them their edge in today’s enterprise landscape:
1. Contextual and Semantic Awareness
Traditional databases tell you facts. Knowledge graphs tell you stories. They connect the dots between people, systems, products, and events — creating a rich, semantic network where data makes sense. Instead of just retrieving information, they help you discover insights.
2. Schema Flexibility and Evolution
Business is anything but static. New processes emerge, priorities shift, and systems evolve. Knowledge graphs adapt easily. You can add new entities and relationships without overhauling your existing structure. They’re built to change as your business changes.
3. Unified Integration Layer
Data comes in all shapes and formats — spreadsheets, databases, APIs, emails, even PDFs. Knowledge graphs can integrate all of it. They act like a connective layer that brings everything into one coherent, searchable map, no matter where the data lives.
4. Powerful Relationship Traversal
Want to find every customer who interacted with your service team more than three times last month and then churned? A knowledge graph can give you that in seconds. Its ability to traverse relationships is what makes it incredibly powerful for analysis, pattern recognition, and decision-making.
5. Transparency, Trust & Explainability
One of the biggest challenges with AI is explainability. Why did the model make that decision? Knowledge graphs help answer that. Every relationship in the graph is traceable, so you can follow the logic, understand the connections, and build trust in your AI outcomes.
6. AI-Ready Foundation
Large language models are great at generating responses, but sometimes they make things up. Knowledge graphs bring structure, facts, and grounding — giving AI a reliable knowledge base to work with. The result? Smarter, more accurate, and more explainable systems.
In short, knowledge graphs bring the human-like ability to connect, reason, and adapt into enterprise data systems. They don’t just organize your information — they help you make sense of it, evolve with it, and get more value from it every step of the way.
Benefits of Using Knowledge Graph
Knowledge graphs do more than organize your data — they unlock it. They help you move from scattered information to meaningful insights, faster decisions, and smarter AI. Whether you’re looking to simplify complexity, personalize experiences, or increase transparency, KGs offer a wide range of benefits across business, technology, and AI.
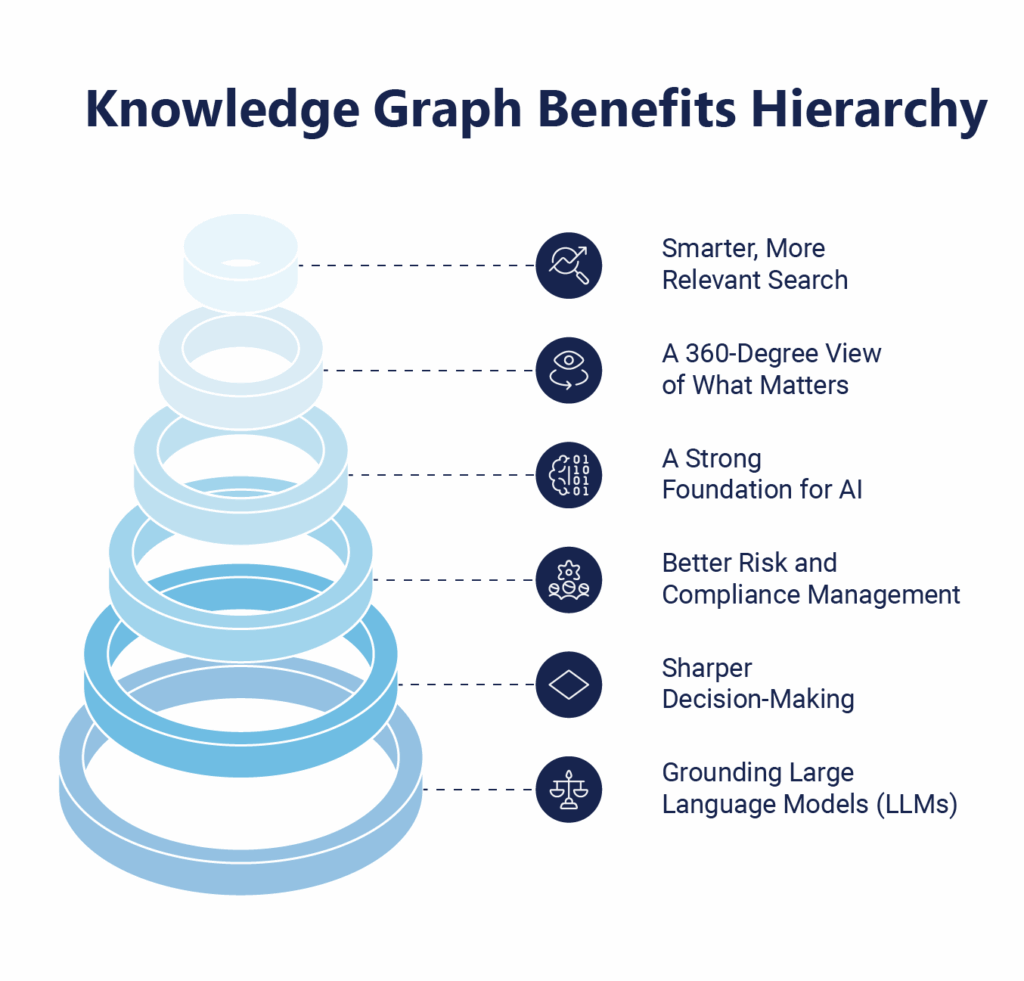
1. Smarter, More Relevant Search
Ever felt like your systems don’t really understand what you’re searching for? Knowledge graphs change that. By using semantic search, they grasp the intent behind queries — not just the keywords. This allows users to get faster, more accurate results, even when asking in natural language
2. A 360-Degree View of What Matters
Imagine seeing every customer, supplier, product, or IT asset — and understanding how they all connect. Knowledge graphs bring together data from across your ecosystem to create complete, unified views. This helps teams make more informed decisions, faster.
3. A Strong Foundation for AI
AI systems are only as good as the context they’re trained on. Knowledge graphs provide that context. They enhance AI models by connecting facts, uncovering relationships, and offering structure — making outcomes more accurate, explainable, and scalable.
4. Better Risk and Compliance Management
In industries where rules are strict and ever-changing, knowledge graphs help keep everything in check. They map regulations, identify risks, and track compliance obligations across business units and geographies. This simplifies audits, strengthens governance, and reduces exposure.
5. Sharper Decision-Making
By revealing hidden connections and patterns, KGs empower leaders with decision intelligence. From diagnosing root causes to running what-if scenarios, they support better planning and more predictive insights — especially in complex environments.
6. Grounding Large Language Models (LLMs)
LLMs are powerful, but without guardrails, they can go off track. Knowledge graphs act as a factual backbone, grounding generative AI in reliable, structured knowledge. This is critical in sectors like healthcare, banking, and legal, where accuracy is non-negotiable.
Use Cases and Applications of Knowledge Graphs
Knowledge graphs are being adopted across industries to solve some of the most persistent data challenges — from smarter search and personalization to AI-driven operations. Below are some of the most impactful use cases:
1. Search and Discovery
Leading tech platforms use knowledge graphs to elevate their search experience. For example, travel platforms connect user preferences, past bookings, seasonal data, and local experiences to offer hyper-personalized suggestions — going far beyond keyword search to deliver intent-based recommendations.
2. Enterprise Data Integration
Pharmaceutical giants have implemented knowledge graphs to unify R&D data across drug discovery, clinical trials, regulatory documents, and academic literature. The result is a consolidated view that shortens research cycles and improves decision-making in real time.
3. Compliance and Risk Intelligence
In the financial sector, knowledge graphs map complex transaction flows and inter-entity relationships to detect fraud, monitor regulatory compliance, and assess systemic risks. Unlike relational databases, KGs can trace suspicious activity across multiple degrees of separation.
4. Customer 360 and Personalization
Digital streaming services use knowledge graphs to understand user behavior at a granular level. By connecting users with songs, genres, moods, and context (time of day, activity), they can generate truly personalized playlists and recommendations.
5. Digital Twins and Intelligent Operations
In IT and manufacturing, knowledge graphs help create real-time digital twins of assets, processes, and environments. By modelling the relationships between applications, APIs, services, and incidents, organizations can enable faster root cause analysis, self-healing systems, and predictive maintenance.
6. Agentic AI and Intelligent Agents
As AI systems evolve into autonomous agents, knowledge graphs play a vital role in grounding their actions. They serve as a live, dynamic model of the world — enabling agents to reason, plan, and make decisions with context and continuity.
7. Healthcare and Life Sciences
Healthcare innovators use knowledge graphs to improve clinical trial design, patient stratification, and drug safety monitoring. By connecting patient records, protocols, trial outcomes, and medical literature, KGs enhance both research accuracy and regulatory compliance.
8. E-commerce and Intelligent Recommendations
E-commerce platforms leverage KGs to understand how products relate to one another, how customers behave across touchpoints, and how preferences shift over time. This helps power everything from upselling and bundling to dynamic pricing and cross-category recommendations.
These applications illustrate why knowledge graphs are becoming foundational to enterprise intelligence. They are not just a better way to manage data — they are a smarter way to make sense of it.
Conclusion
In a world drowning in data, it’s not more information we need – it’s smarter connections. Knowledge graphs offer exactly that: turning scattered data into structured, contextual intelligence that drives real business outcomes.
From powering AI with deeper understanding to enabling faster, more confident decisions, knowledge graphs are becoming the backbone of modern enterprise innovation.
Ready to turn complexity into clarity? Explore how knowledge graphs in Qinfinite, our intelligent application management platform can be your strategic edge powering better decisions, richer customer experiences, and more trustworthy AI.
Connect with us today and see how it all connects.
FAQs Related to Knowledge Graph
A Knowledge Graph (KG) is a structured representation of data that connects entities and relationships, enabling machines to understand and retrieve information efficiently. It integrates diverse data sources, defines relationships through ontologies, and leverages graph databases and AI for insights.
Key components include entities (nodes), relationships (edges), triples (subject–predicate–object), ontologies for structure, and data ingestion layers to unify sources.
Common use cases include fraud detection in banking, drug discovery in pharma, and incident root-cause analysis in IT operations, intelligent search, recommendation engines, and compliance management.
Enterprises use KGs for regulatory risk tracking, real-time IT operations, personalized customer journeys, and AI model enrichment with structured, contextual data.