Accelerate IT operations with AI-driven Automation
Automation in IT operations enable agility, resilience, and operational excellence, paving the way for organizations to adapt swiftly to changing environments, deliver superior services, and achieve sustainable success in today's dynamic digital landscape.
Driving Innovation with Next-gen Application Management
Next-generation application management fueled by AIOps is revolutionizing how organizations monitor performance, modernize applications, and manage the entire application lifecycle.
AI-powered Analytics: Transforming Data into Actionable Insights
AIOps and analytics foster a culture of continuous improvement by providing organizations with actionable intelligence to optimize workflows, enhance service quality, and align IT operations with business goals.
In the pursuit of relentless digital transformation, enterprises are drowning in data but starved for knowledge. IT leaders today are dealing with an explosion of data across systems, platforms, and departments. From CRMs and ERPs to legacy systems and cloud-native applications, the ecosystem is becoming more complex by the day.
Yet, despite having vast amounts of information, organizations struggle with:
- Siloed data repositories that lack connectivity
- Redundant and inconsistent data across systems
- Limited search and discoverability of enterprise knowledge
- Poor context for AI models, reducing the effectiveness of ML and NLP initiatives
- Compliance and governance risks due to poor data lineage
These challenges often trace back to a fundamental issue: data without context is not knowledge. And that’s where Knowledge Graphs come into play. Knowledge graphs help structure and integrate information by capturing relationships between different data points. They enhance data retrieval, improve AI model performance, and provide explainable insights.
In this blog, we’ll explore how to build a knowledge graph for your enterprise—covering its business value, implementation challenges, best practices, and how Qinfinite’s knowledge graph capabilities can accelerate your journey.
A recent survey found that 48% of M&A professionals are now using AI in their due diligence processes, a substantial increase from just 20% in 2018, highlighting the growing recognition of AI’s potential to transform M&A practices.
What is a Knowledge Graph?
In the dynamic landscape of data and knowledge management, knowledge graphs stand out as powerful tools capable of organizing complex relationships and unlocking valuable insights. A KG is a machine-readable data structure describing the relationship between heterogeneous data via a network of nodes (vertices) and links (edges/arcs). KGs represent knowledge of the physical and digital worlds, including entities (people, companies, digital assets) and their relationships, which adhere to a graph data model. It integrates data across silos, links it using meaningful relationships, and surfaces it in a form that both machines and humans can understand.
Originally developed by Google to improve search relevance (“things, not strings”), knowledge graphs have found broader enterprise applications in:
- Enterprise search and discovery
- Customer 360 and personalization
- Fraud detection and compliance
- Supply chain optimization
- AI and ML model contextualization
- Intelligent automation and digital twins
At its core, a knowledge graph doesn’t just answer the “what” in your data—it helps you understand the “how,” “why,” and “what’s next.”
Figure 1: A Knowledge Graph
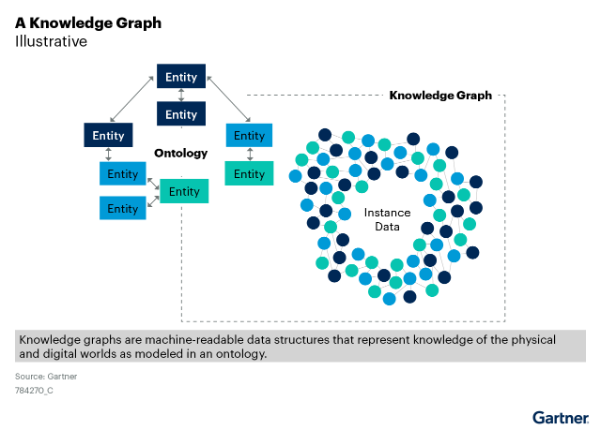
Knowledge Graph Example: Imagine a multinational enterprise that manages thousands of applications, services, and infrastructure components across multiple geographies. With a knowledge graph, the organization creates a connected digital map linking applications to business functions, user access rights, security policies, incident histories, and cloud environments. This unified view allows their IT team to quickly trace the root cause of service disruptions, automatically assess the impact of changes, identify redundant applications for rationalization, and improve AI model training by providing rich, contextual datasets.
The result? Faster decisions, reduced downtime, lower costs, and a more agile, future-ready enterprise.
Why Organizations Need Knowledge Graphs?
For IT leaders, knowledge graphs are more than a data management tool—they are a strategic capability. Here’s why:
- Break Down Silos: Unify data across departments, systems, and sources in a single, queryable model.
- Power Advanced AI: Enable ML/NLP systems to understand entity relationships and context for better predictions and insights.
- Accelerate Digital Transformation: Provide a connected data foundation to modernize legacy systems and enable intelligent automation.
- Improve Decision-Making: Support real-time, contextual analytics by linking structured and unstructured data.
- Ensure Governance and Lineage: Establish traceable relationships and ontologies that align with regulatory needs.
Common Knowledge Graph Implementation Mistakes Enterprises Make
Knowledge graphs promise a unified, intelligent view of enterprise data but many initiatives stall or fail long before delivering value. The problem is rarely the technology itself. More often, it’s a series of strategic and organizational missteps that quietly undermine the effort.
1. Treating the Knowledge Graph as a Side Project
One of the most common mistakes is positioning the knowledge graph as an experimental or “nice-to-have” initiative. When ownership is unclear and executive sponsorship is weak, the graph becomes disconnected from real business priorities. Without being anchored to concrete use cases such as search, recommendations, compliance, or analytics – the knowledge graph struggles to justify ongoing investment and quickly loses momentum.
2. Over-Engineering the Ontology Too Early
Enterprises often fall into the trap of trying to model the entire business domain upfront. While conceptual rigor is important, spending months perfecting an all-encompassing ontology delays value creation and increases the risk of misalignment with actual data and user needs.
Successful teams start small, validate assumptions through usage, and evolve the schema iteratively rather than treating it as a static blueprint.
3. Underestimating Data Quality and Semantics
A knowledge graph amplifies both good and bad data. Many organizations assume existing data sources are “good enough,” only to discover inconsistencies, missing context, and conflicting definitions once everything is connected.
Failing to invest in data normalization, entity resolution, and semantic consistency leads to a graph that looks impressive but produces unreliable or misleading results.
4. Building in Isolation from End Users
Another frequent mistake is designing the knowledge graph without close collaboration with the teams who will actually use it. Engineers and architects may optimize for technical elegance, while analysts, product teams, or business users struggle to extract meaningful insights. A knowledge graph should be shaped by real questions and workflows, not abstract assumptions about how it might be used.
5. Ignoring Governance Until It’s Too Late
Governance is often postponed in the name of speed. However, without clear rules around data ownership, updates, access control, and change management, the graph can quickly become inconsistent or untrusted. Enterprises that delay governance usually end up paying for it later through rework, compliance issues, or declining confidence in the system.
6. Expecting Immediate ROI Without Organizational Change
Knowledge graphs are not plug-and-play solutions. They often require changes in how teams think about data, collaboration, and decision-making. Enterprises that expect instant returns without investing in training, adoption, and cultural alignment are likely to be disappointed, even if the underlying implementation is technically sound.
|
|
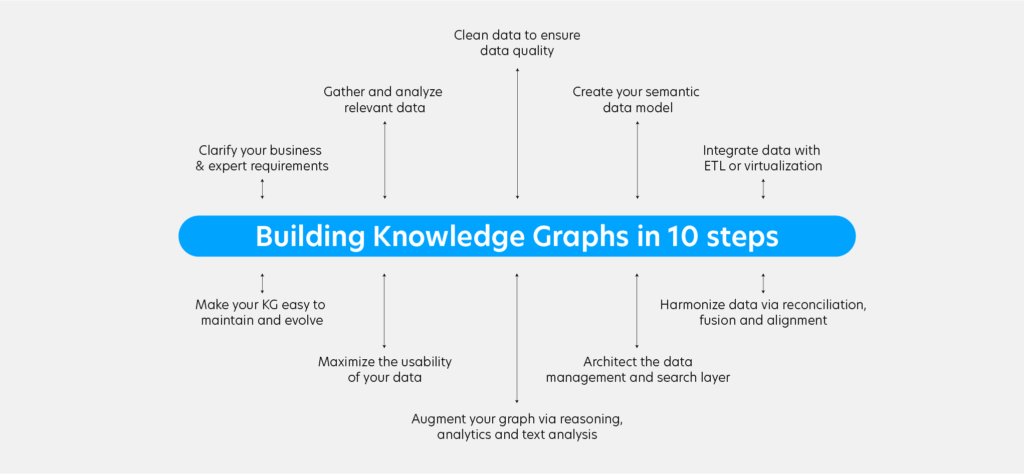
10 Steps to Building a Knowledge Graph
The following steps provide a foundational approach on how to create a knowledge graph. Tailor them to your specific use case and data ecosystem to ensure optimal data quality and relevance.
Step 1: Define the Objective
Before building a knowledge graph, identify the problem it will solve. Whether it’s enhancing AI-powered search, improving recommendation systems, or structuring organizational knowledge, defining the use case is essential.
Step 2: Data Collection and Integration
Knowledge graphs rely on diverse data sources. These can include:
- Structured Data: Databases, spreadsheets, APIs
- Semi-Structured Data: XML, JSON, RDF
- Unstructured Data: Text documents, research papers, customer reviews, social media posts
Step 3: Entity Extraction and Relationship Identification
Use Natural Language Processing (NLP) techniques to extract entities from text and identify relationships. Techniques include:
- Named Entity Recognition (NER): Identifies names, places, organizations
- Dependency Parsing: Identifies relationships between words in a sentence
- Knowledge Base Linking: Connects extracted entities to existing databases like Wikidata
Step 4: Building the Graph Structure
Once entities and relationships are identified, structure them into a graph database. Popular tools include:
- Neo4j
- FalkorDB
- Nebula Graph
- Apache Jena
Each node represents an entity, and edges define relationships. This structure allows for efficient querying and visualization.
Step 5: Data Storage and Indexing
Selecting the right storage solution is crucial for performance. Graph databases optimize storage for connected data, enabling efficient retrieval and traversal of relationships.
Step 6: Implementing Query Mechanisms
Graph databases use specialized query languages like:
- SPARQL: Standard for querying RDF-based knowledge graphs
- Cypher: Used in Neo4j for graph-based queries
These allow for complex searches, such as retrieving all people connected to a specific entity within two degrees of separation.
Step 7: Enriching the Graph with AI & Machine Learning
Enhance the knowledge graph using AI models to:
- Infer new relationships based on existing patterns
- Detect anomalies and inconsistencies
- Improve data categorization
Step 8: Integrating with Large Language Models (LLMs)
To boost AI-powered applications, integrate knowledge graphs with LLMs like OpenAI’s GPT or Google’s Gemini. This combination enhances response accuracy, reduces hallucinations, and improves context-aware decision-making.
Step 9: Visualization and User Interaction
A well-built knowledge graph is only valuable if it’s accessible. Use visualization tools such as:
- GraphX (Apache Spark)
- Gephi
- Linkurious
These allow users to interact with and explore relationships within the data.
Step 10: Continuous Updates and Maintenance
Data is constantly evolving. Implement mechanisms for:
- Regular updates to incorporate new information
- Version control to track changes
- Quality checks to maintain accuracy
How to Evaluate the Applicability of Knowledge Graphs for Your Use Cases
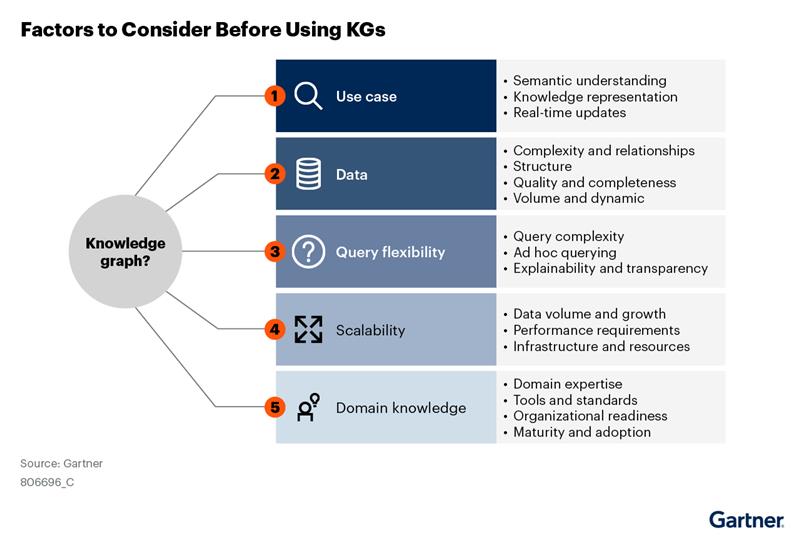
As enterprises face growing complexity in data, systems, and decision-making, knowledge graphs have emerged as a strategic solution to connect, contextualize, and activate information. But while knowledge graphs can offer powerful benefits, they are not a one-size-fits-all solution.
So how can you determine if a knowledge graph is the right fit for your business use case?
Let us outline key criteria and questions to help IT leaders and decision-makers evaluate the applicability of knowledge graphs to their enterprise scenarios.
1. Is Your Data Fragmented Across Silos?
One of the strongest indicators for using a knowledge graph is the presence of siloed data—across applications, departments, or formats.
Ask yourself:
- Are key data assets stored in multiple, disconnected systems (e.g., CRM, ERP, support logs)?
- Is there difficulty in unifying customer, product, or operational data for a single view?
- Do teams duplicate efforts because they can’t see what data already exists elsewhere?
When to Apply a Knowledge Graph: When you need a unified layer that connects diverse data sources without centralizing everything.
2. Are Relationships Between Data Entities Critical?
Knowledge graphs shine in use cases where relationships matter as much as the data itself.
Examples:
- Understanding dependencies between IT assets
- Mapping customer interactions across channels
- Linking products to warranties, contracts, or service history
- Detecting fraudulent behavior through connected patterns
Tip: If your use case involves navigating, analyzing, or inferring relationships, a graph model is highly applicable.
3. Does Your Use Case Require Semantic Understanding?
Unlike traditional databases, knowledge graphs embed semantic meaning—helping machines understand not just data, but context.
Look for signs such as:
- Confusion or ambiguity in data definitions
- Inconsistent terminologies across departments
- The need to map business logic into data (e.g., what defines a “high-value” customer?)
Use Case Fit: When human-readable semantics and machine reasoning are both needed (e.g., for AI/ML, analytics, or automation).
4. Is Your Data Model Likely to Evolve?
Relational schemas are rigid. Knowledge graphs are inherently flexible and adaptable.
Consider this:
- Will you add new data types or relationships frequently?
- Do you expect your organization’s data architecture to change with new tools, acquisitions, or digital products?
- Are you running into friction with schema changes in existing databases?
Go Graph: When you need a data model that evolves alongside your business.
5. Are You Working with Unstructured or Semi-Structured Data?
Knowledge graphs can extract structure and value from documents, emails, PDFs, web pages, and more.
AI-powered entity recognition and relationship extraction can be used to:
- Identify key people, locations, dates, and assets
- Connect insights hidden in free-text or logs
- Integrate structured and unstructured sources into a unified graph
Use Case Example: Contract intelligence, policy comparison, or knowledge management.
6. Do You Need Better Explainability or Traceability?
In regulated industries and AI applications, explainability is crucial.
Knowledge graphs:
- Make relationships transparent
- Allow visual exploration of how a fact or insight was derived
- Track lineage from raw data to decisions
Ideal for: Compliance, financial reporting, healthcare, legal, and explainable AI.
7. Are You Supporting Advanced AI/ML or Search Capabilities?
Graph-enhanced features improve:
- Search relevance (e.g., semantic or contextual search)
- AI model accuracy through enriched feature sets
- Recommendation engines (based on networked relationships)
Perfect Fit: When AI performance is limited by lack of context or poor data relationships.
8. Is There a Need for a Unified Knowledge Layer Across Functions?
Knowledge graphs can act as a shared knowledge backbone across marketing, sales, support, IT, and finance. They enable:
- A single source of truth across teams
- Easier reuse of insights across departments
- Common ontologies and data definitions
Think Enterprise-Wide: When knowledge needs to be democratized and made reusable.
How to Get Started
If you’ve identified a strong use case, here are steps to initiate your knowledge graph journey:
- Define the use case and key entities
- Audit existing data sources and formats
- Select the right graph database and modeling approach
- Develop or adopt ontologies/taxonomies
- Use AI tools to extract relationships and entities
- Build an MVP and iterate
- Integrate with dashboards, APIs, or business apps
- Establish governance and versioning practices
Conclusion
Building a knowledge graph is a powerful way to organize, analyze, and extract insights from unstructured data. By following these ten steps, organizations can develop scalable, intelligent systems that enhance AI applications, improve search capabilities, and support data-driven decision-making. As industries continue to embrace AI and LLMs, knowledge graphs will play a pivotal role in shaping the next generation of intelligent systems.
Building a Knowledge Graph with Qinfinite: A Living Map of Your IT Universe
Our intelligent Application Management (iAM) platform Qinfinite empowers enterprises to build and scale knowledge graphs that act as a living, breathing map of their entire IT landscape. By seamlessly connecting data across applications, systems, and infrastructure, Qinfinite creates a dynamic, AI-powered view of how everything in your IT ecosystem is interrelated.
From real-time dependency mapping and automated insights to faster root cause analysis and smarter decision-making, Qinfinite transforms static data into contextual intelligence—helping you manage complexity, reduce costs, and drive innovation with confidence.
Are you ready to unlock the power of knowledge graphs? Start building your own today!
With iAM, every application becomes a node within a larger, interconnected system. The “intelligent” part isn’t merely about using AI to automate processes but about leveraging data insights to understand, predict, and improve the entire ecosystem’s functionality.
Consider the practical applications:
In the Infinite Game of application management, you can’t rely on tools designed for finite goals. You need a platform that understands the ongoing nature of application management and compounds value over time. Qinfinite is that platform that has helped businesses achieve some great success numbers as listed below:
1. Auto Discovery and Topology Mapping:
Qinfinite’s Auto Discovery continuously scans and maps your entire enterprise IT landscape, building a real-time topology of systems, applications, and their dependencies across business and IT domains. This rich understanding of the environment is captured in a Knowledge Graph, which serves as the foundation for making sense of observability data by providing vital context about upstream and downstream impacts.
2. Deep Data Analysis for Actionable Insights:
Qinfinite’s Deep Data Analysis goes beyond simply aggregating observability data. Using sophisticated AI/ML algorithms, it analyzes metrics, logs, traces, and events to detect patterns, anomalies, and correlations. By correlating this telemetry data with the Knowledge Graph, Qinfinite provides actionable insights into how incidents affect not only individual systems but also business outcomes. For example, it can pinpoint how an issue in one microservice may ripple through to other systems or impact critical business services.
3. Intelligent Incident Management: Turning Insights into Actions:
Qinfinite’s Intelligent Incident Management takes observability a step further by converting these actionable insights into automated actions. Once Deep Data Analysis surfaces insights and potential root causes, the platform offers AI-driven recommendations for remediation. But it doesn’t stop there, Qinfinite can automate the entire remediation process. From restarting services to adjusting resource allocations or reconfiguring infrastructure, the platform acts on insights autonomously, reducing the need for manual intervention and significantly speeding up recovery times.
By automating routine incident responses, Qinfinite not only shortens Mean Time to Resolution (MTTR) but also frees up IT teams to focus on strategic tasks, moving from reactive firefighting to proactive system optimization.
Did you know? According to a report by Forrester, companies using cloud-based testing environments have reduced their testing costs by up to 45% while improving test coverage by 30%.
FAQs Related to How to Build a Knowledge Graph
A Knowledge Graph (KG) is a structured representation of data that connects entities and relationships, enabling machines to understand and retrieve information efficiently. It integrates diverse data sources, defines relationships through ontologies, and leverages graph databases and AI for insights.
Start by defining the use case, gathering and cleaning data, and designing an ontology. Load data into a graph database, enable querying, and apply AI/ML for enrichment. Finally, deploy, visualize, and continuously update the KG for accuracy.
Common tools include graph databases (Neo4j, Amazon Neptune), ontology management (Protégé), query languages (SPARQL, Cypher), ML frameworks (PyKEEN), and visualization tools (Gephi, Cytoscape).
Define objectives, gather and clean data, design an ontology, and store it in a graph database. Enable querying with SPARQL or Cypher, apply AI for inference, and visualize insights. Maintain and update the KG for continuous improvement.