Introduction
AI systems are only as reliable as the data they learn from, retrieve, and use to generate responses. When inaccurate records, missing values, conflicting definitions, or outdated information enter an AI pipeline, the impact goes beyond flawed reports. These defects can distort model predictions, introduce bias into generated responses, and erode trust in automated decisions.
The consequences are already evident as Gartner reports that 38% of infrastructure and operations leaders who experienced AI setbacks cited poor data quality or limited data availability as a direct cause of AI project failure – highlighting the importance of building a reliable data foundation to support successful AI adoption and scale.

“AI reliability begins long before a model generates its first response. It starts with the quality of the data feeding it. Without clear quality standards, measurable validation, and a consistent approach to resolving defects, organizations risk scaling data problems alongside their AI initiatives. A robust data quality framework helps make reliable data a built-in capability, not an afterthought.”
Krishna Kumar Chakkirala
VP – AI & Data, Everforth Quinnox
This is where an effective data quality framework becomes crucial in helping organizations address these challenges systematically by defining quality standards, translating them into measurable rules, and establishing repeatable processes to detect and resolve defects before they compromise business outcomes.
As organizations move from AI experimentation to production deployments, data quality can no longer be treated as a periodic cleanup exercise. It must become an ongoing discipline that reflects how data is consumed, what decisions depend on it, and how much error each use case can tolerate. This is particularly important for AI workloads, where seemingly minor data defects can influence thousands of predictions or retrieved responses.
What is a data quality framework?
A data quality framework is a structured set of standards, rules, ownership arrangements, measurement practices, and remediation processes used to assess whether data is fit for its intended purpose.
The distinction between a framework and a cleanup initiative is important. A cleanup initiative addresses known problems at a particular point in time. A framework establishes the conditions under which quality is defined, tested, measured, and improved continuously. It makes quality repeatable rather than dependent on individual teams noticing problems after they occur.
Without a framework, quality work is largely reactive. A business user discovers an incorrect dashboard figure, an analyst investigates conflicting records, and an engineering team patches the pipeline to resolve the immediate issue. Similar defects may recur because the underlying rule was never formalized or applied consistently across systems.
For AI workloads, this reactive approach creates additional risks. Defective data can enter training datasets, contaminate retrieval indexes, or influence model outputs before anyone recognizes the problem. A well-designed framework moves quality checks earlier in the data lifecycle, making defects easier to detect and less expensive to correct.
The Six Dimensions of Data Quality
The six commonly used data quality dimensions provide a practical foundation for evaluating whether data can be trusted. Each dimension addresses a different type of defect, so organizations should assess them individually rather than assuming that passing one check establishes overall quality.
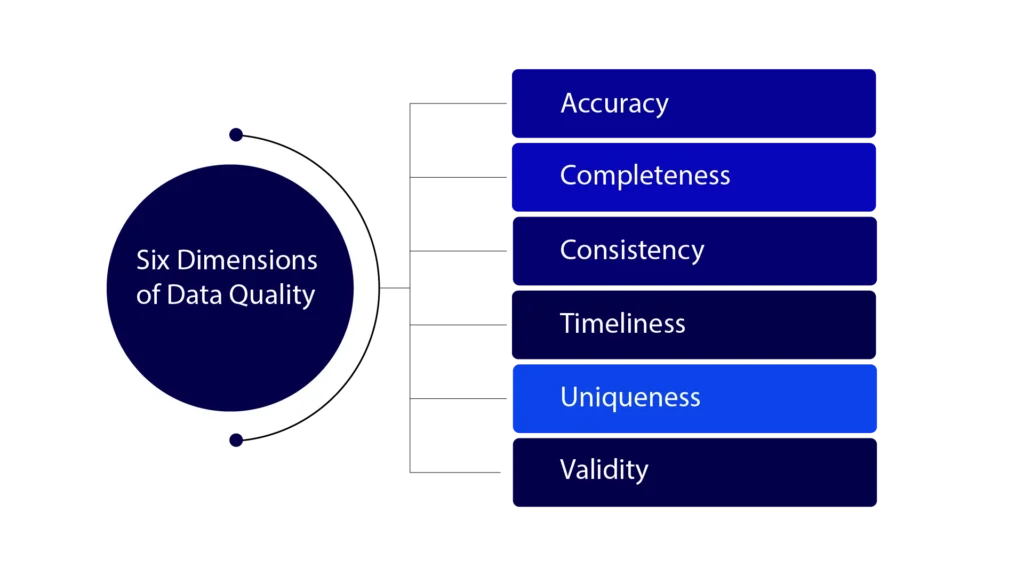
Accuracy
Accuracy measures whether data correctly represents the real-world entity, event, or value it describes.
For example, a customer record may contain a postal code that does not match the customer’s registered address. The record is complete and may follow the expected format, but its information is incorrect.
Accuracy can be measured by comparing selected records against verified source documents, trusted reference datasets, or independently validated outcomes. A basic metric is the percentage of sampled records that match the verified reference.
For AI, inaccurate labels, product attributes, or customer histories can mislead predictions and generate responses that sound convincing but are factually wrong.
Completeness
Completeness measures whether the required data is present for a defined business purpose.
Consider a loan application dataset in which some records are missing employment information or income values. If these fields are necessary for assessing eligibility, their absence can compromise the resulting decision.
A common metric is the percentage of records containing all required fields. Completeness should be assessed against business requirements rather than a universal expectation that every field must be populated. Some fields are legitimately optional, while others are essential for a particular use case.
For AI training and retrieval, missing context can produce incomplete classifications, weaken model performance, or prevent a retrieval system from finding the information needed to answer a question accurately.
Consistency
Consistency measures whether the same information agrees across systems, datasets, and representations.
A customer’s status might be recorded as “Active” in a CRM system but “Inactive” in a downstream analytics platform. Both records may be individually valid, yet the disagreement creates uncertainty about which value should be trusted.
Consistency can be measured by comparing shared attributes across systems and calculating the percentage of records that match according to agreed rules. Cross-system reconciliation is particularly useful when information moves between operational applications and analytical platforms.
In AI workloads, inconsistent product descriptions, policy terms, or entity identifiers can create conflicting retrieval results and reduce confidence in generated answers.
Timeliness
Timeliness measures whether data is available and sufficiently current when a business process needs it.
For instance, a fraud detection model using transaction information that arrives after a significant delay may fail to identify suspicious activity when intervention matters most.
Timeliness can be measured by comparing a record’s availability time with the time it was needed, or by measuring the proportion of records that meet a defined business deadline.
The appropriate threshold depends on the use case. A historical research dataset may tolerate older information, whereas a system supporting transaction decisions may require information from the latest processing cycle. The key is to define acceptable delay according to the decision being supported.
Uniqueness
Uniqueness measures whether each real-world entity or event is represented without unintended duplication.
A customer may appear twice because different applications use different identifiers, or a transaction may be ingested more than once during data integration. These duplicates can distort customer counts, inflate transaction volumes, or cause an AI model to overrepresent certain patterns.
A practical metric is the duplicate-record rate: the number of records identified as unintended duplicates divided by the total records assessed.
For AI, duplicate data can skew training distributions and influence retrieval rankings. However, repeated information is not automatically defective; the framework must distinguish legitimate repetition from records that represent the same entity or event incorrectly.
Validity
Validity measures whether data conforms to defined formats, types, ranges, and business constraints.
A date field containing an impossible calendar date, an email address that violates an accepted format, or an order with a negative quantity where negative values are prohibited would fail a validity check.
Validity is commonly measured as the percentage of records that pass the applicable validation rules. These rules can include permitted values, required patterns, range checks, and relationships between fields.
Validity does not guarantee accuracy. A syntactically correct email address may still belong to the wrong person. Combining validity checks with other dimensions provides a more complete assessment of whether data is suitable for use.
How to Measure Data Quality
To understand how to measure data quality, translate each relevant dimension into a clearly defined metric, calculate it consistently, and evaluate the result against a threshold tied to business risk. The objective is not simply to produce a score; it is to determine whether the data is fit for a specific use.
Turning a dimension into a metric
A useful metric specifies what is being measured, how the result is calculated, which records are included, and how frequently the measurement occurs.
For example, a completeness metric for a customer onboarding dataset could be calculated as:
Completeness (%) = Records with all required fields populated ÷ Total eligible records × 100
Suppose 9,600 out of 10,000 eligible records contain all mandatory fields. Completeness is 96%.
The same approach can be applied to other dimensions using appropriate checks. Accuracy may require comparison with verified references, while uniqueness may require duplicate detection based on defined matching criteria.
Well-defined data quality metrics make results comparable across time and datasets. They also help teams distinguish between a genuine deterioration in quality and a change in the population being measured.
Composite scoring and its limits
A composite score combines multiple dimension-level measurements into a single indicator. It can help leaders understand broad quality trends, but it should never replace the underlying metrics.
For example, a dataset might achieve 98% completeness, 97% validity, and 99% uniqueness, yet contain inaccurate values in a critical financial field. Averaging these scores could make the dataset appear healthy despite a defect that creates significant business risk.
If a composite score is used, the framework should document how dimensions are weighted and whether certain failures automatically disqualify a dataset from a particular use. Critical checks may need to operate as mandatory conditions rather than contributions to an average.
Teams should retain dimension-level results so that an overall score does not conceal a serious weakness.
Setting thresholds that reflect business tolerance, not perfection
Quality thresholds should reflect the consequences of an error, the requirements of the consuming application, and the feasibility of correcting defects.
A marketing analytics dataset may tolerate a small proportion of missing optional attributes. A dataset used to calculate regulatory capital or support eligibility decisions may require much stricter controls for specific fields.
Thresholds should therefore be defined by use case, with clear escalation conditions when results fall outside acceptable limits. They should also be reviewed as business requirements change.
The aim is not to achieve theoretical perfection across every dataset. It is to establish evidence that the data meets the quality requirements of its intended purpose, with stricter controls wherever errors could materially affect decisions.
Writing Data Quality Rules
Data quality rules convert quality expectations into explicit, testable conditions that can be applied consistently. They define what constitutes acceptable data and what should happen when a record or dataset fails a check.
Rules typically live in a shared repository, data catalog, transformation layer, or automated testing configuration, depending on the organization’s architecture. The important consideration is that rules remain discoverable, consistently applied, and connected to the datasets they validate.
Rules should be written in business terms before being translated into technical tests. For example, a business requirement that every completed order must have a valid customer identifier can become a mandatory-field check and a referential integrity test.
Each rule should have a clear description, scope, calculation or validation logic, severity, and expected response to failure. Version control helps teams track changes, understand when a requirement changed, and reproduce earlier validation results when investigating defects.
Not every failure should trigger the same response. A blocking rule stops a pipeline or prevents a dataset from being released when a critical requirement is violated. A warning rule records an exception for investigation when the issue is tolerable or needs further assessment before action. The choice depends on the consequences of allowing defective data to proceed.
For example, a missing mandatory identifier may justify blocking a financial reporting dataset, while a small number of incomplete optional product descriptions may warrant a warning. These decisions should be explicit rather than left to individual interpretation.
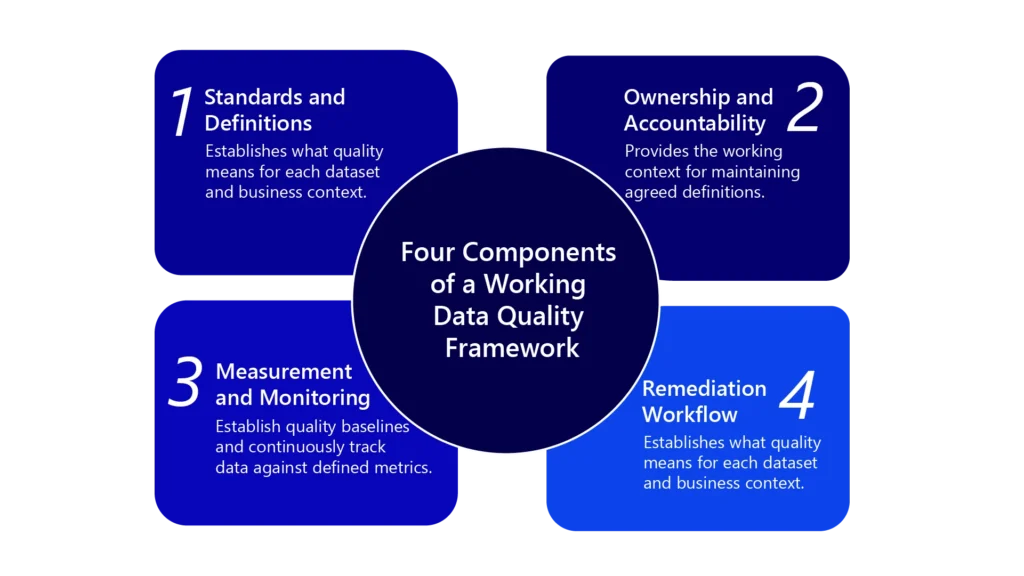
The Four Components of a Working Framework
A data quality framework works when its principles translate into consistent, repeatable practices across the data lifecycle. This requires more than defining quality standards; organizations need clear definitions, established accountability, measurable quality indicators, and a structured approach to resolving issues.
Let’s explore the four components that are important to create a practical foundation for maintaining reliable data, addressing recurring defects, and ensuring that data remains fit for its intended business and AI applications.
Standards and definitions
Standards establish what quality means for each dataset and business context. They define accepted formats, mandatory attributes, reference values, validation criteria, and the conditions under which data is considered fit for use.
Consistent definitions also reduce ambiguity when information moves between applications. Practices such as data standardization help align naming conventions, codes, units, and formats, making data easier to compare and reuse across systems.
Ownership and accountability
Stewardship provides the working context for maintaining agreed definitions, documenting quality expectations, and supporting consistent practices. It connects business meaning with the practical requirements used to assess and improve data quality.
Measurement and monitoring
Measurement establishes the baseline against which quality can be evaluated. Monitoring applies the agreed metrics and rules repeatedly, making it possible to identify when a dataset no longer meets its required standards.
Results should be traceable to specific datasets, rules, and measurement periods. This helps teams identify recurring problem areas and determine whether corrective actions are producing sustained improvements.
Remediation workflow
A remediation workflow ensures that detected defects lead to a defined response rather than remaining unresolved exceptions. The process typically includes recording the issue, assessing its impact, investigating the source, correcting the data or underlying transformation, and validating the result.
For example, if customer records become inconsistent after a system migration, data reconciliation can help compare records across the source and target systems, identify discrepancies, and verify that corrections restore alignment.
The workflow should also distinguish between correcting individual records and addressing the underlying cause. Otherwise, the same defect may reappear in subsequent processing cycles.
Established Frameworks You Can Adapt
Organizations do not need to invent every quality principle from scratch. Established references offer useful starting points, although each must be adapted to the organization’s data landscape and business objectives.
- DAMA-DMBOK: The Data Management Body of Knowledge provides a broad reference for understanding data quality within the wider discipline of data management. It helps organizations connect quality practices with data architecture, metadata, integration, and other related capabilities.
- DAMA UK’s six dimensions: The DAMA UK Data Management Community’s data quality guidance provides a practical vocabulary for assessing characteristics such as accuracy, completeness, consistency, timeliness, uniqueness, and validity. These dimensions help teams structure assessments and communicate quality expectations consistently.
- ISO 8000: This family of international standards addresses data quality and related aspects of data exchange and master data. It can help organizations develop a more structured approach to data requirements, quality characteristics, and interoperability.
These references serve different purposes: one offers a broad body of knowledge, another helps structure quality assessments, and the third provides standards-oriented guidance. Organizations should consult the relevant publications directly when developing their approach rather than treating any reference as a ready-made implementation plan.
What Changes When the Consumer is a Model?
Data quality requirements change when the consumer is an AI model rather than a dashboard or conventional application. A report may remain useful despite a small number of missing attributes or inconsistencies that a human can recognize and interpret. An AI system may process the same defects at scale without understanding that something is wrong.
For model training, incorrect labels, duplicated examples, unrepresentative records, and missing attributes can influence learned patterns. The resulting model may perform poorly on particular cases even when the training dataset appears broadly complete.
For retrieval-augmented generation (RAG), quality extends to the documents, metadata, and relationships used to retrieve relevant context. Outdated policies, conflicting versions of a document, or incomplete product information can cause the system to retrieve misleading evidence. A language model may then produce a fluent answer that faithfully reflects defective source material.
This makes the distinction between acceptable reporting data and fit-for-purpose AI data especially important. Quality thresholds must reflect the model’s task, the cost of an incorrect output, and the consequences of missing or misleading context. High-impact applications may require stricter validation, verified reference information, or explicit rejection of records that fail critical rules.
Silent degradation is another concern. A dashboard may prompt someone to investigate an unexpected number, but an automated model can continue generating outputs without a visible warning. Quality assessments must therefore be designed around how the model consumes data and how errors could affect its results.
Building AI-ready data requires more than making datasets available. It means ensuring that information is sufficiently accurate, complete, consistent, and relevant for the intended AI workload.
Conclusion
A data quality framework gives organizations a repeatable way to establish what good data looks like, measure whether it meets expectations, and correct defects before they undermine business decisions. Its value lies not in the number of checks performed, but in how effectively standards, rules, metrics, and remediation work together.
For AI workloads, this discipline becomes even more important. By adapting established quality dimensions to specific business risks, defining meaningful thresholds, and embedding validation into data pipelines, organizations can build a stronger foundation for reliable AI.
For organizations looking to put these practices into action, strong data engineering services from Everforth Quinnox can help operationalize validation and remediation across data pipelines, while data governance services can support the broader standards and controls needed to sustain trust as AI adoption expands.

Deputy Manager, Marketing, Everforth Quinnox
FAQs
A data quality framework is a structured approach to defining, measuring, monitoring, and improving data quality. It combines standards, validation rules, measurable metrics, and remediation processes to ensure data remains accurate, consistent, complete, and fit for its intended purpose.
The six dimensions of data quality are accuracy, completeness, consistency, timeliness, uniqueness, and validity. Together, they help organizations assess whether data correctly represents real-world information, contains the required values, aligns across systems, is available when needed, avoids unintended duplication, and meets defined formats and business rules.
Data quality is measured by translating quality dimensions into specific metrics and evaluating the results against predefined thresholds. Common measures include the percentage of accurate records, completeness rates, duplicate-record rates, and the proportion of records that pass validation rules. Thresholds should reflect business requirements and the risks associated with each use case.
Data quality focuses on whether data is accurate, complete, consistent, and fit for use. Data governance establishes the broader policies, standards, decision-making structures, and controls that guide how data is managed across an organization. Data governance provides the direction and oversight, while data quality practices help assess and maintain the reliability of the data itself.
AI-ready data is accurate, complete, consistent, relevant, and appropriately structured for its intended AI use case. It should have sufficient context, reliable labels or metadata where needed, and quality checks that help prevent errors from affecting model training, retrieval, or generated outputs. Data must also meet applicable privacy, security, and usage requirements to support reliable and responsible AI adoption.