Accelerate IT operations with AI-driven Automation
Automation in IT operations enable agility, resilience, and operational excellence, paving the way for organizations to adapt swiftly to changing environments, deliver superior services, and achieve sustainable success in today's dynamic digital landscape.
Driving Innovation with Next-gen Application Management
Next-generation application management fueled by AIOps is revolutionizing how organizations monitor performance, modernize applications, and manage the entire application lifecycle.
AI-powered Analytics: Transforming Data into Actionable Insights
AIOps and analytics foster a culture of continuous improvement by providing organizations with actionable intelligence to optimize workflows, enhance service quality, and align IT operations with business goals.
Enterprise IT has evolved into a complex, interconnected web of applications, cloud platforms, micro services, and data pipelines. While this complexity fuels innovation, it also creates unprecedented operational challenges such as service disruptions that span multiple layers, compliance pressures across regions, and an ever-increasing demand for resilience and agility.
Conventional IT management tools are increasingly inadequate in this landscape. They often deliver fragmented snapshots that lack real-time context, rely on static configuration repositories that quickly fall out of sync, and generate isolated data streams rather than cohesive, actionable intelligence. This fragmentation leaves decision-makers navigating blind spots in an environment that demands clarity and speed.
This is where Knowledge Graphs (KG) emerge as a strategic enabler for modern IT operations. By connecting data across your IT landscape into a unified, context-rich view, they offer a foundation for intelligent decision-making and operational excellence. This interconnected perspective empowers organizations to not just react but anticipate challenges, streamline compliance, and drive smarter, faster decisions—setting a new standard for operational excellence in the digital age.
What is a Knowledge Graph in IT Operations?
At its core, a Knowledge Graph represents entities (such as applications, services, infrastructure components, policies, and users) and the relationships between them. This connected data model allows organizations to see not just isolated metrics but how systems impact one another.
For enterprise leaders, the significance is clear; a knowledge graph transforms raw data into a living, dynamic map of the entire digital ecosystem. It bridges operational silos and enables you to understand dependencies, risks, and opportunities in real time.
What Types of Data Can Be Represented in a Knowledge Graph?
Knowledge graphs can encompass virtually every dimension of enterprise IT:
- Infrastructure: Servers, virtual machines, cloud resources, and networks
- Applications: Microservices, APIs, dependencies, and releases
- Operations: Incidents, changes, performance metrics, and SLAs
- Business context: Owners, processes, compliance requirements, and financial impact
- Security: Vulnerabilities, configurations, access controls, and SBOMs
This breadth ensures that decision makers have a holistic view of IT’s role in driving business success.
Why Knowledge Graphs Are a Strategic Imperative for Enterprises
Having a clear and comprehensive understanding of your enterprise environment is more critical than ever. Knowledge graphs empower organizations with unparalleled context, enhancing AI-driven decision-making, and strengthening operational resilience.
The context advantage
In a world where downtime can cost millions per hour, context is king. Knowledge graphs provide that context by linking every part of your IT environment. When a critical application slows down, decision makers can immediately see which infrastructure components are involved, which recent changes might have triggered the issue, and which business processes are at risk.
A foundation for automation and AI
Knowledge graphs form the backbone of AI-driven operations (AIOps). Machine learning models require structured, contextualized data to deliver meaningful insights. With a graph at the core, AI can provide accurate recommendations, explainable reasoning, and predictive capabilities that drive better decisions.
Operational resilience and compliance
Enterprises face growing regulatory scrutiny and must ensure compliance across complex, global operations. Knowledge graphs provide end-to-end visibility into systems, data flows, and controls, making audits and risk assessments far more efficient.
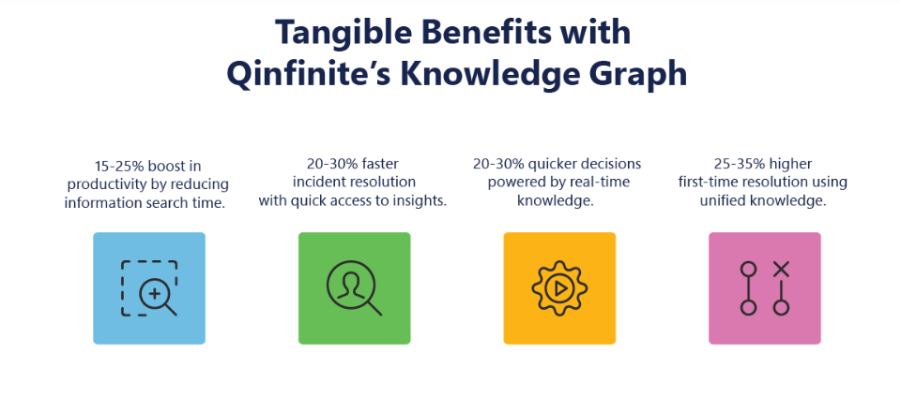
Benefits of Knowledge Graphs for Enterprises
For decision makers evaluating the ROI of new technologies, knowledge graphs deliver measurable value:
- Reduced operational costs: By preventing issues and accelerating resolution, they cut downtime costs significantly.
- Increased agility: Enable rapid adaptation to market demands with better-informed change management.
- Enhanced risk management: Provide comprehensive visibility into dependencies and compliance gaps.
- Sustainable innovation: Build a foundation for continuous improvement through data-driven insights.
For a full exploration of these advantages, explore in detail Benefits of Knowledge Graphs.
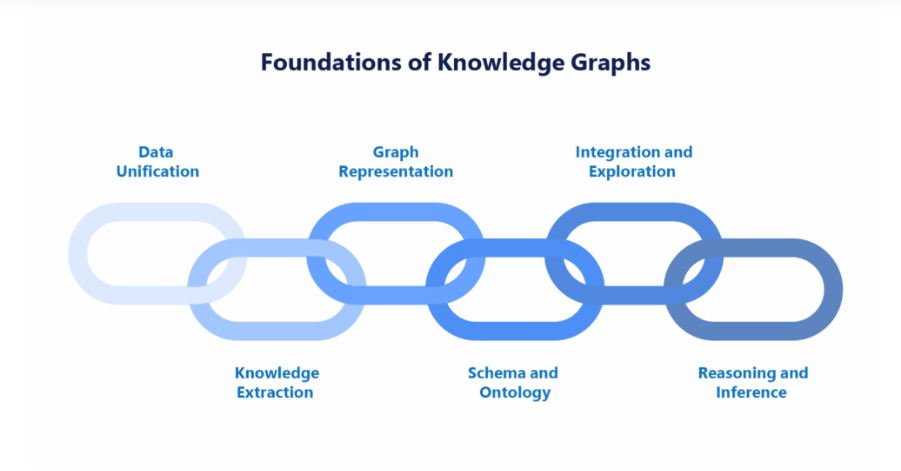
How to Build a Knowledge Graph for Enterprise IT Operations
The path to a successful knowledge graph implementation begins with clarity of purpose. Enterprise leaders should focus on outcomes such as reduced mean time to resolution (MTTR), improved change success rates, and enhanced compliance readiness.
Key steps include:
- Define critical use cases: Focus on high-impact goals like incident resolution, change risk management, or regulatory compliance.
- Integrate strategic data sources: Combine data from monitoring, service management, and cloud APIs, and security platforms.
- Establish governance and quality controls: Assign data ownership, enforce validation rules, and monitor graph health continuously.
- Invest in scalable technology: Use platforms that can evolve with your business and support AI-driven analytics.
- Ensure organizational buy-in: Communicate the value to stakeholders beyond IT, such as risk management, compliance, and business operations teams.
For practical insights on building a robust graph, read Build a Knowledge Graph.
Enterprise Use Cases: Where Knowledge Graphs Deliver Tangible Impact
1. Executive-Level Visibility: Turning Complexity into Clarity
Modern IT environments are vast and fragmented, leaving decision makers with incomplete or outdated insights. A knowledge graph unifies this complexity into a real-time map of how IT services support business outcomes. Leaders can see how every system, application, and process connects, enabling smarter investment decisions, accurate risk assessments, and transparent reporting to stakeholders. This clarity transforms IT from an operational burden into a strategic asset.
2. Incident and Problem Management: Resolving Issues before They Impact Business
Unplanned downtime erodes customer trust, drains revenue, and harms brand reputation. Knowledge graphs equip enterprises to move beyond reactive firefighting by accelerating root cause analysis, uncovering recurring issues, and preventing future disruptions. The result is reduced resolution times, improved service levels, and a consistent ability to meet customer expectations under pressure.
3. Change Risk Mitigation: Innovate Without Fear of Failure
Change is essential for growth, but every update carries risk. Knowledge graphs bring confidence to innovation by showing the real-world impact of proposed changes before they are implemented. They reveal hidden dependencies, reduce failed deployments, and allow organizations to move faster without jeopardizing stability. For enterprises, this means accelerated transformation backed by operational resilience.
4. Security and Compliance: Building Trust through Proactive Control
The stakes in cybersecurity and regulatory compliance have never been higher. A knowledge graph strengthens defences by linking assets, vulnerabilities, and policies into one connected view. This makes it easier to detect emerging threats, close security gaps, and demonstrate compliance with confidence. Enterprises that adopt this approach not only reduce exposure but also build trust with customers, partners, and regulators.
5. AI-Powered Decision Support: From Reactive to Predictive Operations
Data-driven decisions require context, and that is precisely what a knowledge graph provides. By enriching data with relationships and meaning, it enables predictive analytics, informed decision-making, and intelligent automation. Enterprises gain the ability to anticipate issues, optimize performance, and align IT operations with long-term strategic goals, creating a competitive advantage in an increasingly dynamic marketplace.
How Do Knowledge Graphs Support Smarter Decision-Making?
Decision makers today face an avalanche of data but lack the context to act effectively. Knowledge graphs bridge this gap by:
- Connecting operational metrics to business outcomes
- Highlighting the most critical risks and opportunities
- Enabling faster, evidence-based decisions in high-stakes scenarios
With a knowledge graph in place, you no longer react to isolated incidents; you anticipate, prevent, and optimize with confidence.
How Qinfinite Uses Knowledge Graphs to Elevate IT Management
Whether you’re aiming to reduce downtime, optimize performance, or drive digital transformation, Qinfinite’s intelligent application management (iAM) platform is designed to help you stay ahead of the curve. Unlike traditional Configuration Management Databases (CMDBs), which often become outdated and fragmented, Qinfinite Knowledge Graph offers a living, contextual representation of IT assets, enabling IT teams to:
- Gain a single source of truth that integrates data from on-premises systems, cloud platforms, and SaaS applications.
- Identify patterns from historical incidents and predict future risks, reducing downtime and improving service levels.
- Empower leaders with actionable insights that tie technical metrics to business outcomes.
- Preserve institutional knowledge by connecting past incidents and resolutions, ensuring teams make informed decisions even as personnel change.
Conclusion
Knowledge Graphs offer a revolutionary way to visualize and manage the intricate web of applications, services, and infrastructure that modern enterprises rely on. By providing a living, interconnected blueprint of your IT ecosystem, Knowledge Graphs enable teams to anticipate issues before they escalate, accelerate root cause analysis, and align IT operations more closely with business goals.
Qinfinite’s Knowledge Graph takes this concept further by integrating real-time data, automating insights, and delivering proactive intelligence tailored to your organization’s unique IT landscape.
Ready to transform your IT operations with the power of Knowledge Graphs? Discover how Qinfinite can unlock new levels of visibility, agility, and efficiency for your enterprise.
Get in touch with us today for a personalized consultation and see firsthand how Qinfinite’s Knowledge Graph can be the blueprint for your modern IT success.
FAQs About Knowledge Graph
A knowledge graph is more than a data structure; it is a strategic asset. It connects every element of your IT ecosystem—applications, infrastructure, processes, and policies—into a living, real-time model. This context empowers executives to make faster, more informed and strategic decisions that directly impact business performance.
Qinfinite embeds a dynamic knowledge graph at the core of its AIOps platform, transforming raw operational data into actionable intelligence. It provides unified visibility across hybrid environments, predicts issues before they occur, and links IT performance directly to business objectives. This enables leaders to confidently drive growth while maintaining operational stability and cost efficiency.
Knowledge graphs deliver measurable enterprise value. They lower operational costs by reducing downtime, increase agility by enabling safer and faster change, strengthen risk management by exposing hidden dependencies, and unlock the full potential of AI-driven innovation. For decision makers, this translates into a more resilient, competitive, and future-ready business.
Executives today face an overload of data but lack actionable insight. Knowledge graphs cut through the noise by linking data points into meaningful relationships, enabling decisions based on context, not guesswork. They provide foresight rather than hindsight, turning IT from a reactive function into a proactive enabler of strategic outcomes.
Knowledge graphs can unify virtually all critical enterprise data i.e. technology assets, applications, security vulnerabilities, compliance controls, business processes, and even financial metrics. This holistic view ensures that IT decisions are aligned with organizational priorities and long-term goals.