Accelerate IT operations with AI-driven Automation
Automation in IT operations enable agility, resilience, and operational excellence, paving the way for organizations to adapt swiftly to changing environments, deliver superior services, and achieve sustainable success in today's dynamic digital landscape.
Driving Innovation with Next-gen Application Management
Next-generation application management fueled by AIOps is revolutionizing how organizations monitor performance, modernize applications, and manage the entire application lifecycle.
AI-powered Analytics: Transforming Data into Actionable Insights
AIOps and analytics foster a culture of continuous improvement by providing organizations with actionable intelligence to optimize workflows, enhance service quality, and align IT operations with business goals.
|
Have you ever wondered how Netflix suggests eerily accurate movie picks based on your mood, or how Amazon knows exactly what to suggest based on your past purchases, even when you’re shopping for something totally new? These aren’t just smart algorithms—they’re powered by knowledge graphs: the silent engines driving relevance, context, and intelligence.
Behind the scenes, tech giants like Netflix and Amazon use knowledge graphs to connect data points across billions of entities—products, behaviors, locations, people, and more—to deliver remarkably intuitive experiences. And now, this once-elite technology is moving into the hands of forward-thinking enterprises across industries.
In the age of intelligent enterprises, it’s not just about collecting data—it’s about connecting it. Knowledge graphs are the blueprint for how modern businesses will think, decide, and act in real time.
-Akshay Deshpande, Chief Technology Officer, Qinfinite
According to Gartner, by 2025, graph technologies will be used in 80% of data and analytics innovations, up from 10% in 2021, facilitating rapid decision-making across enterprise domains. As C-level executives—especially CEOs, CIOs, CTOs, and CDOs grapple with increasing complexity of disconnected data silos, unpredictable customer behavior, rising risk, and pressure to modernize—knowledge graphs offer a powerful answer. They bring semantic clarity, contextual understanding, and real-time adaptability to data, empowering organizations to make faster, smarter, and more holistic decisions.
This blog delves deep into the business value knowledge graphs bring, how they align with executive priorities, and how CXOs can build a strategic roadmap to adopt them effectively. Let’s dive in.
Understanding Knowledge Graphs
A knowledge graph is a connected data structure that represents entities (people, places, products, etc.) and the relationships between them. Think of it as a semantic network that mirrors how humans understand and associate information—with context and meaning.
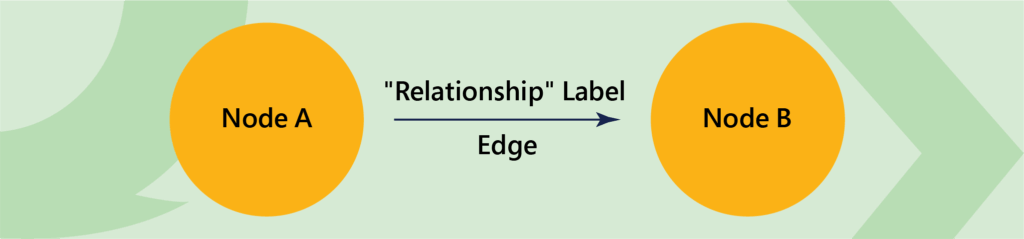
Imagine “Node A” as a customer and “Node B” as a product. The edge between them could represent the relationship “purchased”. Multiply this by thousands of entities and interactions across your business, and you get a dynamic map of how everything is interconnected—the foundation of enterprise intelligence.
Unlike traditional relational databases, knowledge graphs are schema-flexible, context-aware, and can ingest heterogeneous data from across your enterprise ecosystem.
Key Characteristics:
- Semantic understanding: Links data through meaning, not just structure.
- Flexible data model: Evolves as your business and data landscape change.
- Inferencing and reasoning: Enables AI and ML to derive new knowledge from existing connections.
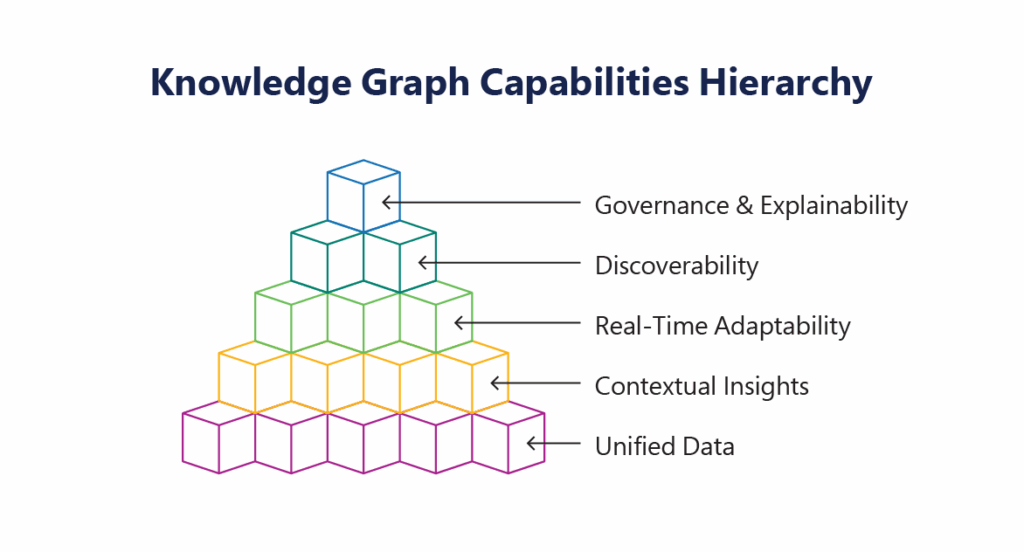
5 Core Capabilities That Make Knowledge Graphs Business-Critical
As enterprises navigate a rapidly evolving data-driven landscape, the ability to extract meaningful, real-time insights from complex, distributed information is becoming a strategic imperative. Knowledge graphs address this challenge head-on by offering a flexible, semantic data foundation designed for intelligent decision-making and scalability.
Let’s explore the five core capabilities of knowledge graphs and how they drive real business value — especially in data-heavy industries like banking and retail.
1. Breaking Down Data Silos with Graphs
In large organizations, data is often fragmented across departments, platforms, and systems. Traditional data integration methods struggle to unify this information due to inconsistent formats, naming conventions, and semantics.
Knowledge graphs seamlessly integrate structured, semi-structured, and unstructured data across silos by linking them through a semantic model that understands relationships and context.
For Instance, banking customer data may be scattered across CRM systems, transaction logs, KYC documents, and credit scoring systems. A knowledge graph connects these points — creating a holistic profile that links “Jane Smith” from the CRM to her accounts, past transactions, and credit history. And the outcome: single view of the customer (SVoC), streamlined compliance checks, and personalized financial advice.
Quick Stat: Did you know? According to IDC Market Research, incorrect or siloed data can cost a company up to 30% of its annual revenue.
2. How Graphs Deliver Deeper Insights
Traditional BI systems often fall short in delivering why something happened — they report the “what,” but not the relationships or dependencies that provide context. Knowledge graphs overcome this by capturing semantic relationships between data points, mimicking the way humans think.
This leads to:
- Smarter, context-enriched recommendations.
- Dynamic reasoning for decision support.
- Root-cause analysis across interconnected domains.
3. Real-Time Adaptability and AI Readiness
Enterprises need their data architecture to keep pace with change — whether it’s onboarding a new data source, responding to market fluctuations, or adapting machine learning models. Knowledge graphs are schema-flexible and support real-time updates, making them ideal for feeding connected, labeled data to AI/ML models, ingesting new relationships without reengineering and enabling explainable AI with traceable reasoning.

4. Enhanced Discoverability with Semantic Intelligence
Search capabilities improve significantly when powered by semantic understanding. Knowledge graphs transform traditional keyword-based search into concept-based search, enabling users to find what they mean, not just what they type.
A compliance officer looking for “all customers linked to high-risk transactions in 2023” can retrieve insights through semantic queries, even if “high-risk” is defined differently across systems.
5. Stronger Governance, Lineage, and Explainability
With increasing scrutiny around data privacy, model explainability, and compliance (e.g., GDPR, HIPAA, Basel IV), knowledge graphs offer built-in advantages through their transparent structure.
They provide:
- Clear lineage — showing where data came from and how it evolved.
- Visual traceability of decision paths in AI systems.
- Granular access control and policy enforcement.
According to a recent industry survey, 67% of CDOs consider data transparency and traceability the top priority for enabling trustworthy AI and regulatory compliance.
Real-World Knowledge Graph Use Cases
Knowledge Graphs (KGs) are driving real transformation across industries by connecting the dots between structured and unstructured data, enabling businesses to move from reactive to predictive, from siloed to synergistic.
Here are five powerful use cases that demonstrate the practical impact of KGs:
Customer 360 & Personalization
In a world where customers interact across digital platforms, stores, chatbots, and service centers, data becomes increasingly fragmented. A Knowledge Graph can unify all these disparate data points—purchase histories, product preferences, browsing behaviors, support interactions—into a holistic customer profile. This empowers companies to deliver real-time, hyper-personalized experiences that drive loyalty and conversion.
Risk Management & Compliance
Financial institutions and insurers face escalating regulatory demands, from Anti-Money Laundering (AML) to KYC and Basel III. Knowledge Graphs reveal hidden relationships between entities such as accounts, devices, transactions, and jurisdictions—identifying patterns that traditional systems overlook. In fraud detection, for example, graphs make it possible to surface indirect links between shell companies, high-risk merchants, and customer cohorts, significantly improving the accuracy of alerts.
Operational Intelligence
Many enterprises struggle with fragmented visibility across supply chains, finance, production lines, and support operations. By integrating data across ERP systems, third-party vendors, customer orders, and sensor logs, Knowledge Graphs build a unified operational model. This allows businesses to identify process inefficiencies, pinpoint root causes of delays, and uncover dependencies that impact timelines or cost .
Accelerating R&D & Innovation
Research teams across pharma, automotive, and technology sectors are buried under a deluge of disconnected knowledge—from patents and scientific articles to customer feedback and test results. Knowledge Graphs link these sources semantically, helping teams discover patterns, avoid duplication, and unlock innovation faster.
Enterprise Search & Knowledge Discovery
Organizations are sitting in a goldmine of internal knowledge trapped in PDFs, email threads, chat logs, internal portals, and CRMs. Employees spend a disproportionate amount of time searching for relevant information. Knowledge Graphs enhance enterprise search with semantic context—understanding the meaning behind queries and surfacing relevant insights across structured and unstructured sources.
Strategic Advantages for CXOs
Now that we’ve explored what knowledge graphs do, let’s translate those technical capabilities into business outcomes for the C-suite. Here’s how different CXO roles can extract direct, strategic value:
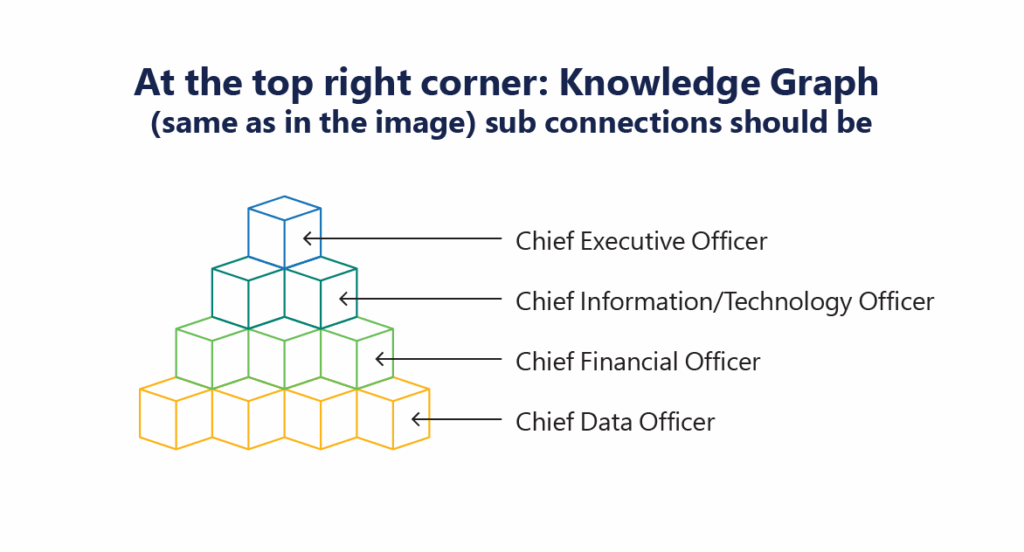
CEO: Turn Data into a Competitive Advantage
As a CEO, your focus is on sustainable growth, innovation, and market differentiation. Knowledge graphs serve as a strategic data foundation that supports faster innovation and sharper customer-centric strategies.
- Build data products that evolve quickly with market needs.
- Launch new services powered by connected intelligence (e.g., embedded finance, hyper-personalized retail).
- Accelerate M&A integrations by mapping and aligning data assets from Day 1.
Value Delivered: Shorter innovation cycles, new revenue streams, and stronger competitive positioning.
CIO/CTO: Simplify Architecture, Improve Agility
CIOs and CTOs are constantly balancing legacy system constraints with the pressure to modernize. Knowledge graphs offer a lightweight, interoperable layer on top of existing systems — reducing architectural complexity without requiring rip-and-replace strategies.
- Integrate new data sources or APIs without schema redesign.
- Enable cross-system queries and analytics in real-time.
- Power semantic search and intelligent automation across the enterprise.
Value Delivered: Agile modernization, reduced integration effort, and improved data infrastructure ROI.
CFO: Reduce Data Costs, Drive Efficiency
For CFOs, knowledge graphs deliver strong ROI by reducing data silos, lowering integration costs, and enabling better forecasting and spend management.
- Replace expensive ETL pipelines with real-time data mapping.
- Improve decision accuracy by integrating financial, operational, and external data.
- Support compliance and risk audits with traceable, relationship-rich data models.
Value Delivered: Lower TCO, faster insights, and better financial governance.
CDO: Enable Governance and Trusted Analytics
CDOs are tasked with data governance, quality, and compliance — all while driving analytics maturity. Knowledge graphs bring transparency to data lineage, usage, and relationships.
- Enable data cataloging with context — not just metadata.
- Improve data quality through connected validation.
- Enforce governance policies with semantic rule enforcement.
Value Delivered: Trustworthy, compliant, and high-utility enterprise data.
Qinfinite in Action: Delivering Continuous Business Insight Through Knowledge Graphs
A major highlight from the highly anticipated report, “2025 and Beyond: Redefining Business with Intelligent Application Management (iAM),” underscores how our intelligent application management platform, Qinfinite, is pushing the boundaries of Knowledge Graph technology. The report describes Knowledge Graphs as the “continuous insight layer” that powers intelligent, self-healing digital ecosystems—precisely what Qinfinite delivers.
By unifying diverse data sources into a dynamic, context-rich graph, Qinfinite provides CxOs with real-time visibility into complex interdependencies across the enterprise. This seamless connectivity transforms fragmented data into actionable insights—enabling faster decisions, proactive risk management, and smarter innovation.
Download the full report here to explore how Qinfinite is redefining enterprise automation through continuous graph-powered insight: https://www.quinnox.com/qinfinite/intelligent-application-management-2025-guide/
What’s Next: Why Knowledge Graphs Are the Future of Enterprise Intelligence
As the data landscape continues to grow in complexity, CxOs must rethink how they extract value. The answer is no longer in more dashboards or reports—but in smarter connections. And knowledge graphs are the key to making those connections count. Knowledge graphs are not just a data architecture shift—they are a business transformation enabler. They don’t just answer “what happened?”—they help you understand “why,” “how,” and “what next?”
For CXOs, the question is not if you should invest in knowledge graphs, but how soon can you harness them to drive decision intelligence, innovation, and enterprise agility. Leveraging solutions like Qinfinite, CXOs can confidently lead their organizations through complex digital transformations, unlocking unprecedented business value from their data assets.
Need help building an enterprise knowledge graph strategy? Talk to our Experts Today!
With iAM, every application becomes a node within a larger, interconnected system. The “intelligent” part isn’t merely about using AI to automate processes but about leveraging data insights to understand, predict, and improve the entire ecosystem’s functionality.
Consider the practical applications:
In the Infinite Game of application management, you can’t rely on tools designed for finite goals. You need a platform that understands the ongoing nature of application management and compounds value over time. Qinfinite is that platform that has helped businesses achieve some great success numbers as listed below:
1. Auto Discovery and Topology Mapping:
Qinfinite’s Auto Discovery continuously scans and maps your entire enterprise IT landscape, building a real-time topology of systems, applications, and their dependencies across business and IT domains. This rich understanding of the environment is captured in a Knowledge Graph, which serves as the foundation for making sense of observability data by providing vital context about upstream and downstream impacts.
2. Deep Data Analysis for Actionable Insights:
Qinfinite’s Deep Data Analysis goes beyond simply aggregating observability data. Using sophisticated AI/ML algorithms, it analyzes metrics, logs, traces, and events to detect patterns, anomalies, and correlations. By correlating this telemetry data with the Knowledge Graph, Qinfinite provides actionable insights into how incidents affect not only individual systems but also business outcomes. For example, it can pinpoint how an issue in one microservice may ripple through to other systems or impact critical business services.
3. Intelligent Incident Management: Turning Insights into Actions:
Qinfinite’s Intelligent Incident Management takes observability a step further by converting these actionable insights into automated actions. Once Deep Data Analysis surfaces insights and potential root causes, the platform offers AI-driven recommendations for remediation. But it doesn’t stop there, Qinfinite can automate the entire remediation process. From restarting services to adjusting resource allocations or reconfiguring infrastructure, the platform acts on insights autonomously, reducing the need for manual intervention and significantly speeding up recovery times.
By automating routine incident responses, Qinfinite not only shortens Mean Time to Resolution (MTTR) but also frees up IT teams to focus on strategic tasks, moving from reactive firefighting to proactive system optimization.
FAQs Related to Knowledge Graphs Business Impact
A knowledge graph is a semantic data model that connects entities and their relationships, providing context-rich insights. CXOs should care because it transforms fragmented data into a unified, actionable asset—enabling smarter decisions, innovation, and competitive advantage.
Industries with complex, siloed data like banking, retail, healthcare, manufacturing, and telecom benefit the most. Knowledge graphs enable real-time insights, regulatory compliance, and improved customer experiences by connecting data across systems and channels.
No. Many platforms offer low-code or no-code interfaces, making it easy for business and data teams to build and manage graphs. AI expertise helps in advanced use cases, but it’s not a barrier to getting started.
Enterprises typically see ROI within 6–12 months. Use cases like customer 360, compliance, and operational visibility deliver early wins by replacing manual processes and improving data-driven decisions.
Yes. Modern, cloud-native graph platforms scale horizontally and can handle billions of nodes and relationships. They’re built to support enterprise-grade workloads across departments and use cases.
By capturing detailed context and relationships, knowledge graphs enable hyper-personalization and precise recommendations. They help businesses understand customer behaviors and preferences deeply, driving more relevant interactions and increasing loyalty.