Accelerate IT operations with AI-driven Automation
Automation in IT operations enable agility, resilience, and operational excellence, paving the way for organizations to adapt swiftly to changing environments, deliver superior services, and achieve sustainable success in today's dynamic digital landscape.
Driving Innovation with Next-gen Application Management
Next-generation application management fueled by AIOps is revolutionizing how organizations monitor performance, modernize applications, and manage the entire application lifecycle.
AI-powered Analytics: Transforming Data into Actionable Insights
AIOps and analytics foster a culture of continuous improvement by providing organizations with actionable intelligence to optimize workflows, enhance service quality, and align IT operations with business goals.
In a world driven by data, finance leaders are not starved for information, they are starved for insight. From regulatory pressure to cyber risk and personalized customer engagement, the finance industry demands real-time clarity across interconnected domains. Yet, data remains locked in silos. Systems remain disconnected. Decisions often lag behind events.
What if your enterprise could connect every customer, transaction, risk event, and regulation in a dynamic, real-time web of intelligence? This is the transformative promise of a Knowledge Graph (KG).
This blog explores how knowledge graphs are solving critical pain points in finance. We will walk through key use cases, quantify the benefits, and share how industry leaders are turning data complexity into business advantage. Whether you are modernizing risk analytics, enabling hyper-personalization, or strengthening compliance, this is your blueprint for graph-powered transformation.
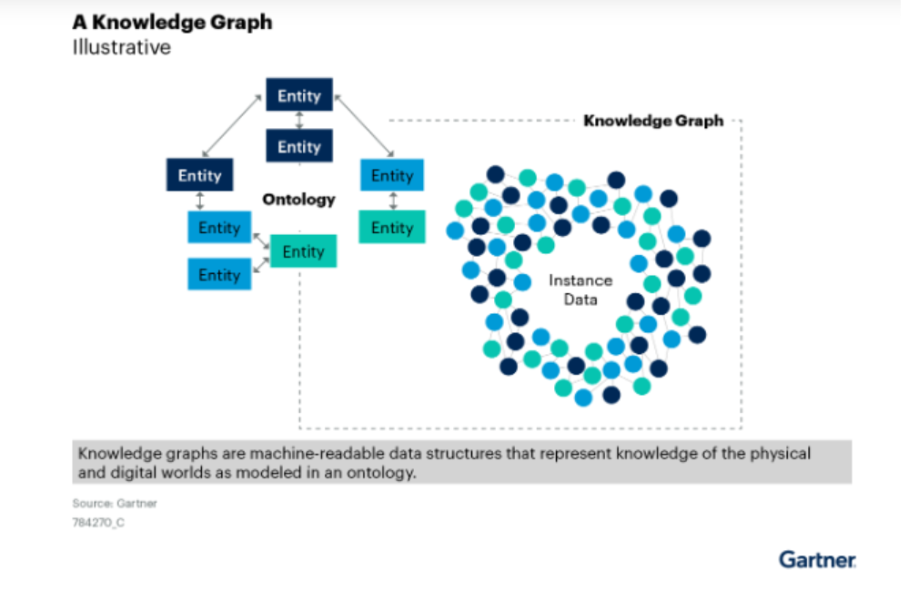
What Is a Knowledge Graph and Why Should You Care?
At its core, a knowledge graph is a semantic data model that connects entities (such as people, transactions, and accounts) through relationships. It is more than a database; it is a living map of your business context.
Imagine being able to answer questions like:
- Which customers are indirectly exposed to sanctions risks through their business networks?
- How are fraudulent transactions connected across devices, regions, and accounts?
- What regulatory obligations apply to a customer segment in real time?
Traditional systems cannot answer these questions easily or quickly. A knowledge graph can.
Building a knowledge graph is about enabling context-aware decision-making. For decision-makers, it shifts the paradigm from reactive reporting to predictive intelligence.
The Finance Mandate: Why Knowledge Graphs Now?
The macro signals are clear:
- Rising regulatory scrutiny around AML, ESG, and data privacy
- Escalating fraud sophistication exploiting cross-channel vulnerabilities
- Increasing customer expectations for personalized, real-time experiences
- Legacy IT limitations that inhibit agility and insight generation
The ability to integrate, interpret, and act on connected data is now foundational to competitiveness and this is exactly what knowledge graph use cases in finance are enabling today.
Strategic Use Cases: Where Knowledge Graphs Drive Impact in Finance
1. Advanced Fraud Detection and Anti-Money Laundering (AML)
Fraud is no longer linear and operates through complex, hidden networks. Knowledge Graphs model these networks natively.
A financial knowledge graph reveals hidden connections between individuals, accounts, devices, geographies, and behaviours. For instance, if three different loan applications originate from different names but the same device, this link is detected instantly.
Impact: Financial institution using a graph-based fraud engine tend to see improvement in detection accuracy and reduction in false positives.
See how Enterprise Knowledge Graphs enable real-time risk detection and continuous learning.
2. Regulatory Compliance with Transparent Data Lineage
From MiFID II to Dodd-Frank and GDPR, financial institutions are expected to trace, explain, and report every decision.
A knowledge graph creates a provable, auditable chain of data flow and decision logic. It links regulations to policies, data sources, decision engines, and even human interactions. Regulators increasingly demand this level of clarity.
Impact: Organizations adopting this approach report up to 50% faster compliance reporting cycles and improved audit readiness.
3. Hyper-Personalized Customer Engagement
Today’s customers expect contextual interactions. Generic messages do not cut through.
A knowledge graph merges customer transactions, digital behaviours, relationship networks, and life events into a 360-degree view. This enables timely product recommendations, smarter service journeys, and frictionless onboarding.
Impact: Financial institutions using graph-powered personalization report a 25 – 30% increase in product conversions and significant NPS gains.
Read how bizops insights and IT-business alignment power customer-first strategies.
4. Holistic Credit Risk and Exposure Analysis
Risk is not siloed. Yet, traditional models focus on narrow data sets. Knowledge graphs expand the lens.
By integrating structured (credit history) and unstructured (news, ESG data, macroeconomic signals) insights, graphs enable a richer risk profile of both customers and counterparties.
Impact: Lenders using this approach have improved their non-performing loan (NPL) forecasts by 20% and reduced underwriting cycle time by 30%.
5. Investment Research and Market Signal Fusion
Sell-side and buy-side analysts sift through news, financials, filings, and sentiment. Graphs connect these dots, reveal relationships, and flag real-time triggers.
Example: When a supplier in a geopolitical hotspot faces disruption, the graph automatically flags impacted portfolio companies and supply chains.
Impact: Fund managers using graph-enhanced intelligence are making faster, more informed investment decisions across volatile markets.
Building the Foundation: How to Implement a Knowledge Graph in Finance
Implementation success starts with a well-defined strategy. Here is a pragmatic framework:
1. Start with Business-First Ontologies
Do not start with data. Start with questions. What insights matter to your fraud team? What exposures does your risk officer need to trace? Design your graph model around these priorities.
2. Integrate Across Ecosystems
Your graph should connect data from core banking systems, CRMs, transactional systems, ESG feeds, and regulatory databases. Tools like the Qinfinite Knowledge Graph come pre-integrated with major financial platforms.
3. Ensure Continuous Learning and Freshness
Graphs are not static. They must evolve as new data flows in. Set up streaming pipelines and entity resolution engines to keep the graph alive.
4. Enable Human + AI Collaboration
Visualize the graph for analysts. Integrate AI modules for anomaly detection and trend prediction. Marry ability to explain with automation.
How Quinnox Accelerates Graph Value Realization
At Quinnox, we help financial institutions build, deploy, and scale enterprise-grade knowledge graphs with speed and impact with the help of our intelligent Application Management (IAM) platform Qinfinite.
At the core of Qinfinite is its Enterprise Knowledge Graph, which offers a dynamic, interconnected view of applications, infrastructure, and business processes. This approach addresses key challenges in the finance industry, such as technical debt, operational complexity, and the need for real-time, data-driven decision-making.
Key Benefits of Qinfinite’s Knowledge Graph for the Finance Industry
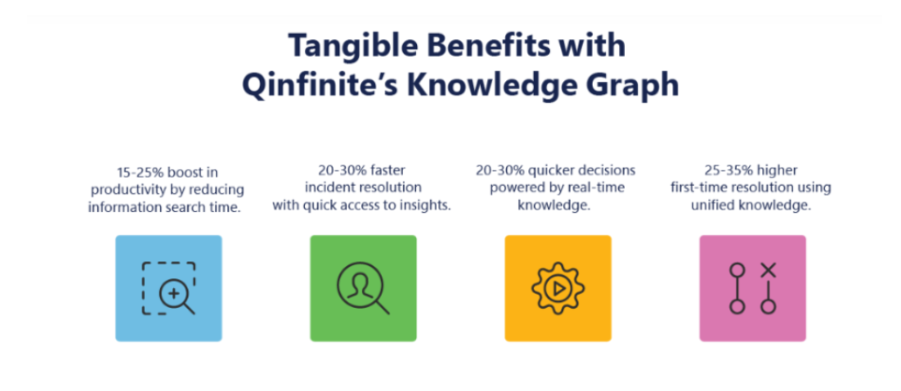
1. Enhanced Visibility and Risk Management
Qinfinite’s Knowledge Graph maps complex relationships between applications, processes, and business units, providing a comprehensive view of the IT landscape. This visibility enables financial institutions to proactively identify and mitigate risks, ensuring compliance and reducing exposure to potential threats.
2. Operational Efficiency and Cost Optimization
By automating the discovery of dependencies and redundancies, Qinfinite helps financial organizations streamline their IT operations. This leads to significant cost savings and improved resource allocation, enhancing overall operational efficiency.
3. Accelerated Incident Resolution
The platform’s ability to trace historical changes and visualize interdependencies allows for rapid root cause analysis. This capability reduces downtime and accelerates incident resolution, ensuring continuous service availability.
4. Strategic Business Alignment
Qinfinite’s integration of IT data with business processes enables financial institutions to align their technology investments with strategic objectives. This alignment supports informed decision-making and drives business growth.
5. Proactive Security and Compliance
The Knowledge Graph’s comprehensive mapping of IT assets aids in identifying potential security vulnerabilities and compliance gaps. This proactive approach enhances the institution’s security posture and ensures adherence to regulatory requirements.
Final Word to Finance Decision Makers
Knowledge graphs are not just a technology trend. They are a strategic enabler for financial organizations navigating uncertainty, complexity, and transformation. By aligning systems, people, and decisions through connected intelligence, finance leaders can drive clarity, agility, and growth.
The question is no longer if knowledge graphs matter. It is how soon your organization can operationalize one.
Let’s co-create your financial knowledge graph strategy because the future of finance is not siloed. It is connected. Schedule a personalized session with Qinfinite experts to get started!
FAQs on Financial Knowledge Graph
It is a semantic model that connects financial entities and their relationships (e.g., customers, accounts, regulations), enabling contextual, real-time decision-making.
They identify hidden relationships between users, devices, accounts, and behaviors to detect fraud patterns that traditional systems miss.
No. Mid-sized institutions and fintechs are adopting graph models for agility, risk control, and customer intelligence.
Data lakes store raw data. Knowledge graphs organize that data into meaningful relationships, enabling semantic understanding and real-time insights.
By creating a unified, enriched profile of each customer, enabling personalized services, timely offers, and contextual support across channels.