Introduction
Most enterprises today do not suffer from a lack of data. They suffer from a lack of shared understanding.
Boards push for growth, resilience, and efficiency. Business leaders demand faster change and more insight. CIOs and technology leaders must juggle complexity in applications, data, integrations, and security, while keeping the lights on and still enabling innovation.
Somewhere between strategy presentations and system diagrams, meaning gets lost. Different teams use different terms for the same concepts. Business cases and architecture decks do not quite line up. Critical decisions wait because no one can see the full picture across processes, applications, data, and risk.
Knowledge graphs offer a way out of this pattern. A knowledge graph represents customers, products, applications, policies, events, and more, as a network of entities and relationships. It transforms raw data into a network of meaning that humans and machines can both reason over.
In simple terms, a knowledge graph gives your enterprise a living map of what matters and how it connects. For leadership, that map becomes a strategic instrument. It aligns IT and business around a shared, contextual view of the organization, making collaboration less about translation and more about decisions and outcomes.
This blog explains what knowledge graphs are, why IT and business often struggle to work as one, how knowledge graphs bridge that gap, and how leaders can implement them responsibly at scale.
What Are Knowledge Graphs
A knowledge graph is a way of representing information as a set of entities and the relationships between them. Instead of storing data in isolated tables, a knowledge graph connects people, systems, products, processes, and events as a graph of nodes and edges. This is how people naturally think about the world, as webs of related concepts, so it becomes intuitive for business and IT teams alike.
Traditional databases are excellent for transactions and reporting, but they are not designed to model rich relationships across many domains. A knowledge graph, by contrast, treats relationships as first class. It allows leaders to ask questions that span systems and perspectives, for example:
- Which revenue generating processes depend on this legacy platform
- Which applications touch personally identifiable information in a particular geography
- Which customer segments will be impacted if this service changes
The Qinfinite Knowledge Graph builds on this principle. It connects operational data, metadata, and business context to create a continuously updated intelligence layer across the IT and application landscape.
Why IT and Business Often Struggle to Collaborate
The gap between IT and business is not simply a communication issue. It is structural, cognitive, and operational. Understanding these root causes helps leaders see why knowledge graphs are so powerful.
Structural fragmentation
Most enterprises have grown through years of change, mergers, and technology waves. As a result, they have:
- Multiple application portfolios across regions and business units
- Data scattered across warehouses, lakes, reports, and tools
- Different documentation standards and partial process maps
Each function optimizes for its own needs. Business teams build spreadsheets and slide decks. IT teams maintain architecture repositories and CMDBs. Rarely do these sources align into one consistent view.
Cognitive misalignment
Business stakeholders think in terms of revenue, cost, risk, and customer outcomes. IT teams think in terms of integration patterns, technical debt, and operating models. Both viewpoints are valid, but they frame the same reality in very different ways.
Without a shared model of the enterprise, conversations often degrade into translation exercises. Leaders ask questions like “Which systems support this product line” and receive answers framed around platforms and modules, not customer journeys and value streams.
Time scale conflict
Business teams are judged on quarterly outcomes, new revenue, and market moves. IT teams are judged on availability, stability, and long-term sustainability. Business naturally pushes for speed, while IT naturally guards against risk.
When there is no shared view of dependencies and impact, IT tends to say no or ask for more time, and business interprets this as resistance. The underlying issue is not attitude. It is lack of transparent context.
The Quinnox perspective in BizOps insights for IT and business alignment describes this as a gap between strategic intent and operational reality. Without a unifying lens, organizations struggle to bring both together.
How Knowledge Graphs Bridge the Gap
Knowledge graphs act as a connective tissue between technology assets and business outcomes. They do not remove complexity, but they make it visible, navigable, and explainable.
A shared semantic layer
At the heart of a knowledge graph implementation is a business centric ontology. This is a structured vocabulary of concepts and relationships such as customer, product, channel, application, control, and risk.
When a leader explores the graph they see business concepts first, and can then drill down into technical details. IT teams see the same graph and can navigate in the opposite direction, from technical component to business impact. This shared semantic layer is what turns a graph into a collaboration engine.
Transparent impact analysis
Because relationships are explicit, knowledge graphs excel at impact analysis. A change request can be traced through the graph to show:
- The capabilities and processes that depend on the system
- The products and customer segments likely to be affected
- The controls, SLAs, and regulatory obligations that need review
This reduces the defensive posture that IT often adopts in change discussions. Instead of saying “we need to be careful” in general terms, teams can point to specific dependencies and risks that business can understand and prioritize.
Bridging insight and execution
Classical business intelligence focuses on reporting and dashboards. Architecture tools focus on system level detail. Knowledge graphs connect these worlds by enabling questions that traverse both.
For example, a leader can ask:
“Show me all high margin products in North America that depend on applications running on unsupported middleware, and the incidents associated with those applications in the last twelve months.”
Foundation for AI assistants that both sides trust
Modern AI assistants become far more reliable when grounded in a knowledge graph that encodes enterprise truth. Instead of a generic chatbot trained only on public information, leaders can deploy assistants that:
- Answer “how does this process work” using the latest graph data
- Explain “what breaks if we change this application” with traceable reasoning
- Provide “why” answers that link to both IT and business perspectives
Because the graph comes from curated enterprise sources, both IT and business are more likely to trust the results, and more willing to rely on AI for routine questions.
Practical Enterprise Use Cases of Knowledge Graphs
Knowledge graphs are not just an abstract architectural idea. They drive value across specific domains where IT and business must work together.
Application portfolio and modernization planning
Leaders can use knowledge graphs to:
- See which applications support which business capabilities
- Understand redundant or overlapping functionality
- Flag applications with high incident rates against revenue contribution
- Prioritize modernization based on business criticality and risk
With this view, modernization stops being a purely technical exercise. The CFO, COO, and CIO can jointly endorse a value-oriented roadmap.
Enterprise application management and operations
In operations, knowledge graphs support faster diagnosis and smarter automation. When an incident occurs, the graph can show:
- All services, processes, and customer journeys touched by the affected application
- Recent changes across configuration, code, or dependent systems
- Known failure patterns linked to root causes
Customer and partner 360 intelligence
Knowledge graphs excel at unifying data about customers, partners, and journeys. They can link interactions across channels, contracts, support tickets, and billing systems into one connected picture.
From a leadership standpoint, this matters because it allows the organization to:
- Identify high value segments and the systems that matter most to them
- Understand where process friction is caused by system fragmentation
- Design better experiences that cut across silos
Risk, compliance, and policy mapping
Regulated industries need traceable relationships between regulations, policies, controls, processes, and systems. A knowledge graph can encode these relationships so that a change in regulation triggers clear impact analysis.
Instead of chasing spreadsheets, risk officers and CIOs gain a shared view of where obligations sit in the architecture, which controls apply where, and where gaps may exist. This reduces audit surprise and allows for more proactive risk management.
Data quality and governance
Because knowledge graphs make relationships explicit, they highlight inconsistencies, duplicates, and missing data. Leaders can see where conflicting definitions of customer or product exist, which sources are authoritative, and where governance needs strengthening.
Over time, this supports a virtuous cycle. Better definitions lead to better graphs. Better graphs make inconsistencies more visible, which drives further improvement.
AI and analytic innovation
An enterprise knowledge graph is an ideal foundation for:
- Retrieval augmented generation solutions that answer complex questions with context
- Recommendation engines that factor in both behaviour and business rules
- Predictive models that include structural signals from dependencies and relationships
The result is not just more models, but better decisions, because AI is grounded in an accurate representation of how the enterprise actually works.
How to Implement Knowledge Graphs in Your Organization
For leadership, the key is to treat knowledge graphs as a strategic capability, not a one-off technical project. A structured path helps.
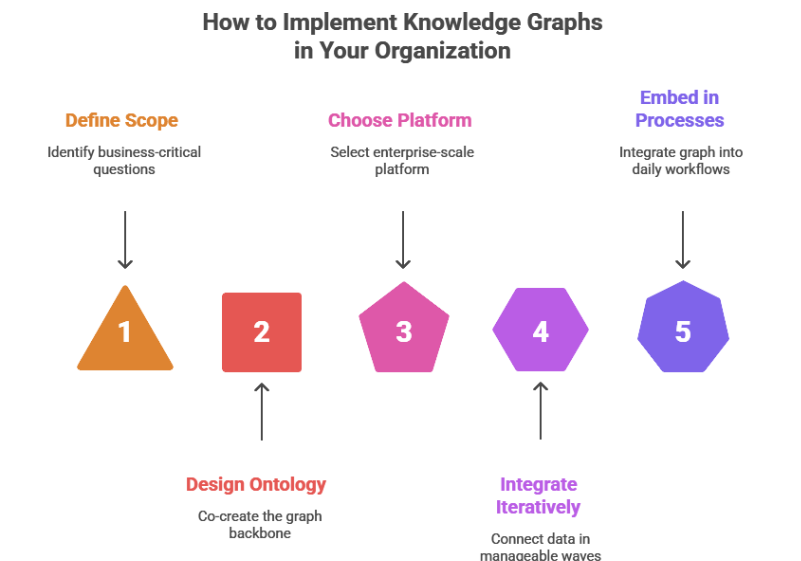
Start with business-critical questions
Begin by identifying a small set of questions that currently take too long to answer or rely on guesswork. Typical candidates include:
- Which applications can we safely retire this year
- What is the true impact of a particular platform risk or vendor exit
- Where do we have inconsistent definitions of customer or product
- Which services are most critical to our most valuable segments
These questions define the initial scope of the graph. They ensure that the early implementation delivers tangible value and builds trust.
Design the ontology with joint ownership
The ontology is the backbone of the knowledge graph. It describes the entities, attributes, and relationships that matter. Designing it is both a business and a technical exercise.
Leaders should sponsor a joint working group where enterprise designs, data leaders, and business owners co create this model. This co creation step prevents the graph from becoming an IT side asset and ensures that business terms and metrics are properly reflected.
Choose a platform that is fit for enterprise scale
The platform must handle security, access control, versioning, integration, and performance at enterprise scale. It should integrate with existing tools and support AI workloads.
Integrate iteratively, not all at once
A common mistake is to attempt a big bang graph that covers every domain. This leads to long timelines and stakeholder fatigue. Instead, connect data and systems in waves, each tied to a real initiative such as cloud migration, application modernization, or regulatory change.
At each wave:
- Extend the ontology as needed
- Add new data sources and validate relationships
- Publish new graph views and use cases to stakeholders
This iterative approach allows the graph to grow in value and credibility over time.
Embed the graph into decision and delivery processes
A knowledge graph only bridges the IT business gap if teams actually use it in their daily work. Leaders can hard wire the graph into:
- Architecture review boards and investment committees
- Business case templates for major initiatives
- Incident and change management processes
- Portfolio governance and prioritization
This ensures that discussions are based on shared facts from the graph, rather than individual spreadsheets or subjective views.
Challenges and Considerations
Knowledge graphs unlock significant value, but they also introduce new responsibilities. Addressing these early makes the difference between a compelling proof of concept and a sustainable capability.
1. Ontology design and scope creep
If the ontology is too narrow, the graph will not answer the questions leadership cares. If it is too broad, implementation will stall. Leaders should insist on a clear, staged roadmap for ontology growth, aligned with business priorities.
2. Data quality, lineage, and trust
A knowledge graph is no better than the data and relationships it contains. Enterprises need clear policies for-
- Which systems are considered the source of truth for each entity
- How conflicts between sources are resolved
- How updates propagate through the graph and are audited
Investing in data stewardship and lineage tracking is not optional. It is what turns the graph into a trusted asset for executives.
3. Integration and performance engineering
Bringing multiple heterogeneous systems into a graph requires thoughtful engineering. Teams must manage data volumes, update frequency, and integration patterns. The good news is that enterprise knowledge graph practices and tooling have matured significantly, making this challenge easier to handle than it was a few years ago.
4. Operating model and ownership
Someone needs to own the graph as a product. That typically means a cross-functional team with-
- A product owner from the business or transformation office
- Enterprise architects and data engineers
- Governance and risk representatives
Without a clear owner and backlog, the graph risks becoming a static inventory instead of a living intelligence layer.
5. Change management and culture
Finally, knowledge graphs challenge how people work. Architects must move from isolated diagrams to shared models. Business stakeholders must trust a central source instead of building their own side spreadsheets.
This requires communication, training, and visible leadership sponsorship. The narrative should be clear. The graph is not yet another IT tool. It is the way the enterprise will see itself going forward.
Conclusion
Digital transformation, AI adoption, and complex regulatory environments are all raising the stakes for effective collaboration between IT and business.
Knowledge graphs provide a new foundation. They represent the enterprise as a network of meaning, where systems, processes, data, and outcomes are all connected in a way that humans and machines can understand. When combined with platforms such as Qinfinite Knowledge Graph, they become a practical, scalable way to align strategy and execution.
For leaders, the question is not whether to explore knowledge graphs. It is how quickly you can turn them into a strategic asset. The organizations that succeed will be those that:
- Use knowledge graphs to unite IT and business around one shared model of reality
- Embed that model into decision making, operations, and innovation
- Combine the graph with AI to create assistants and analytics that reflect enterprise truth
In a world where advantage comes from how well you understand and act on your own knowledge, a well-implemented enterprise knowledge graph is less an experiment and more a new core capability.
FAQs
A knowledge graph is a structured representation of entities and their relationships. In an enterprise, it serves as a connected map of applications, data flows, processes, customers, and business concepts. This unified view helps teams understand dependencies, improve decision-making, and accelerate transformation initiatives.
Knowledge graphs create a common language. They present information visually and contextually so both groups can understand how systems support business outcomes. This shared view reduces misalignment and accelerates collaboration.
Leaders gain clearer insights, faster decisions, improved governance, better risk management, more efficient operations, and stronger alignment between technology and strategy. Knowledge graphs also enhance the effectiveness of AI and automation initiatives.
Knowledge graphs do not replace warehouses or lakes. They enhance them by adding context, meaning, and relationships. Warehouses store data. Lakes store raw information. Knowledge graphs connect this information, so it becomes actionable and intelligible for decision-making.