A single unplanned IT incident can ripple across customer experience, revenue, employee productivity, and brand trust in minutes. Yet for many organizations, the real challenge isn’t the incident itself – it’s the lack of clarity around how well the organization responds when things break.
Incidents are a reality of modern operations. Systems grow more distributed, dependencies increase, and complexity becomes unavoidable. What separates resilient organizations from fragile ones is not the absence of incidents, but the ability to detect issues early, respond decisively, resolve them quickly, and learn from every failure. Without measurable performance signals, incident response devolves into guesswork – reactive, inconsistent, and dependent on individual effort rather than engineered processes.
The data makes this gap impossible to ignore. Unplanned downtime routinely costs enterprises hundreds of thousands of dollars per hour, yet many teams still rely on anecdotal post-mortems or ticket counts to assess effectiveness. Activity is mistaken for progress. Leaders are left without answers to critical questions:
- Are incidents being detected fast enough?
- Where do delays actually occur?
- Which failures cause the greatest business impact?
This is exactly where incident management KPIs and metrics earn their place. They convert operational noise into actionable insight. They expose bottlenecks, highlight risk patterns, and provide a fact-based foundation for continuous improvement. More importantly, they allow organizations to shift from reactive firefighting to predictable, scalable, and resilient operations.
In this blog, we break down the 10 most important incident management KPIs and metrics every organization should track – not just what they measure, but why they matter, how to calculate them correctly, and how to apply them to drive meaningful outcomes.
Stat to Note: Gartner reports that the average cost of IT downtime is $5,600 per minute – that’s over $300,000 per hour of lost productivity, sales, and customer trust.
What are Incident Management Metrics & KPIs?
Every incident leaves a trail behind it – timestamps, alerts, escalations, workarounds, handoffs, and ultimately a resolution. Most organizations capture this data, but very few truly use it. Incident management metrics exist to turn that trail into insight.
At their core, incident management metrics are signals that describe how your organization behaves under stress. They show how quickly problems surface, how decisively teams respond, how effectively issues are resolved, and how reliably services recover. These measurements span the entire incident lifecycle – from the first symptom to the final fix and post-incident learning.
Not all metrics are created equal, however. Tracking raw data points – such as total ticket count or number of alerts – can tell you what happened, but not whether you’re improving. This is where Key Performance Indicators (KPIs) come in. KPIs are metrics that are deliberately tied to outcomes that matter to the business: uptime, customer trust, operational efficiency, and risk reduction.
For example, while you might track total number of incidents as a raw count, coupling it with mean time to resolve allows you to measure team responsiveness and operational maturity. Together, KPIs help teams make objective, data-driven decisions about improving service reliability, team performance, and customer experience.
This is why mature organizations don’t look at metrics in isolation. They examine relationships between them. A low MTTR combined with a high reopen rate may indicate rushed fixes. A declining incident count paired with rising severity could point to fewer but more damaging failures. Metrics, when interpreted together, expose the story behind the operations.
In environments like IT service desks, network operations centers, cloud platforms, and security operations teams, incident KPIs act as an operational truth layer. They provide leadership with a fact-based view of resilience and give teams a shared language to discuss performance, bottlenecks, and improvement – without relying on anecdote or intuition.
Why You Need KPIs for Incident Management
Tracking KPIs for incident management isn’t just a nice-to-have – it’s essential for several reasons:

1. Drive Faster Mean Times to Recovery
Organizations using structured incident KPIs such as MTTR, MTTD, and MTTA can dramatically reduce the time systems are degraded or unavailable. According to Atlassian research, Mean Time to Resolve (MTTR) remains one of the most adopted performance indicators, used by 86% of respondents.
2. Enable Benchmarking and Continuous Improvement
KPIs create measurable benchmarks. Are you resolving incidents faster this quarter than last quarter? Are teams closing tickets within SLA targets? Without KPIs, such improvements are subjective.
3. Improve Customer Trust and Operational Visibility
KPIs like SLA compliance rate and customer satisfaction provide proof points to stakeholders that your team is meeting expectations and commitments.
4. Support Predictive and Proactive Operations
Tracking historical KPI trends enables teams to shift from reactive break-fix work to proactive problem prevention – a key competency in high-performing DevOps and SRE cultures.
In short, incident KPIs don’t just measure performance – they shape behavior. They focus attention on what matters, align teams around shared goals, and provide the feedback loop required to build resilient, dependable operations at scale.
10 Top Incident Management KPIs & Metrics
Effectively managing incidents is more than fixing problems – it’s about measuring performance in a way that drives improvement. Below are the 10 most impactful KPIs and metrics that technology leaders and operations teams use to benchmark success and elevate reliability.
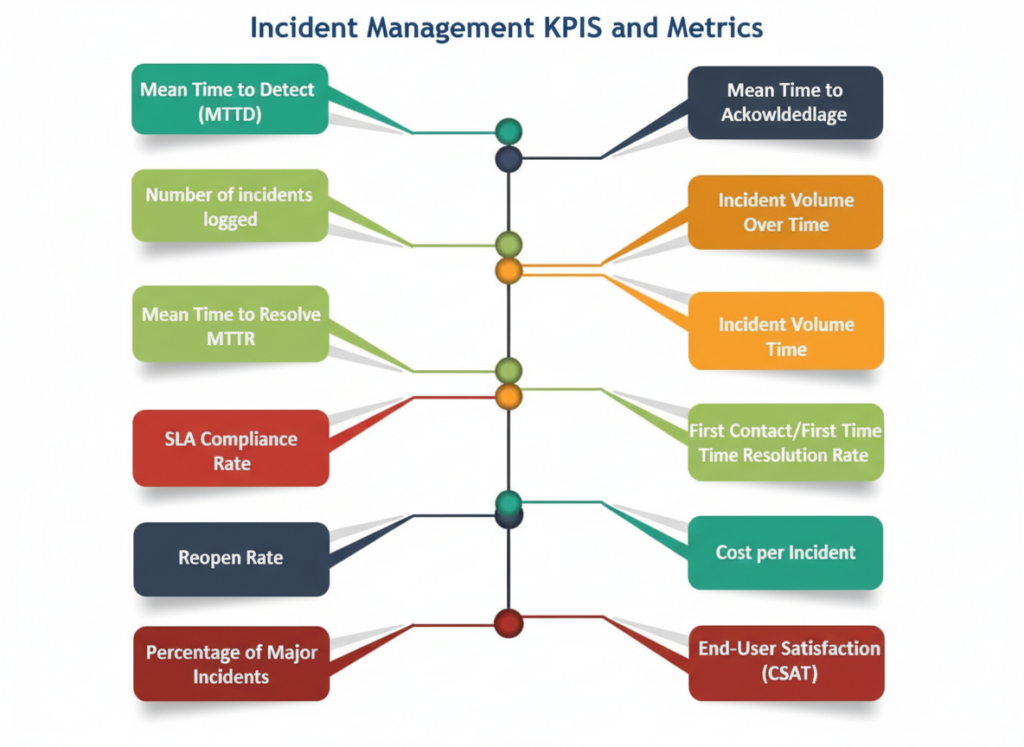
1. Mean Time to Detect (MTTD)
MTTD is the average time between an incident starting and it being detected by monitoring or alerts.
The faster you detect incidents, the less impact they have. High MTTD suggests gaps in monitoring tools or alerting thresholds. A lower MTTD means quicker action and faster recovery.
For Example: If a server issue begins at 10:00 AM and your monitoring picks it up at 10:07 AM, your MTTD is 7 minutes.
How to measure: Total time from incident start to detection ÷ number of incidents.
Tracking MTTD means assessing how well your observability stack identifies true problems vs noise.
How APM and Observability Optimize Application Performance
2. Mean Time to Acknowledge (MTTA)
MTTA measures how long it takes from when an alert is generated to when a human (or team) acknowledges it and begins working on resolution.
Even if incidents are detected swiftly, delays in human acknowledgment directly increase interruption time. A shorter MTTA shows responsiveness and effective alert routing. MTTA reveals not just technical maturity but also staffing responsiveness and alert fatigue issues.
How to measure: Time of acknowledgement – time of alert.
3. Mean Time to Resolve (MTTR)
MTTR is the average time it takes from when an incident is acknowledged to when full resolution (system functionality restored) occurs. MTTR is perhaps the most fundamental incident performance indicator, showing how effective your team is at fixing problems. Lower MTTR generally equates to faster recovery and lower business disruption.
Industry Insight: MTTR remains one of the most widely tracked KPIs because it directly correlates with customer impact and operational resilience.
How to measure:(Total resolution times for all incidents) ÷ (number of incidents).
4. Incident Volume Over Time
The count of incidents recorded over a set period (daily, weekly, monthly, quarterly, annually). Understanding incident trends allows teams to forecast workload, identify systemic issues, and assess the impact of major changes like releases or infrastructure upgrades. This KPI acts as a leading signal for underlying process and quality issues.
For Example: A weekly spike in incident volume after every software release might signal release quality issues.
How to measure: Sum of incidents recorded in a time period.
5. SLA Compliance Rate
The percentage of incidents resolved within pre-defined Service Level Agreements (SLAs). SLA compliance is a key business metric – it reflects whether teams are meeting expectations set with customers or internal stakeholders. High SLA compliance means dependable service and reliable operations.
How to measure: (Number of incidents resolved within SLA ÷ total incidents) × 100
6. First Contact/First Time Resolution Rate
The proportion of incidents resolved on first contact without any escalation or reopening. This KPI measures both efficiency and quality of initial troubleshooting. High first contact resolution often correlates with better training, better documentation, and customer satisfaction. According to a Reddit study, excellent teams aim for a first contact rate above 70–80% for support environments
How to measure: (Number of incidents closed on first contact ÷ total incidents) × 100.
7. Reopen Rate
Percentage of incidents reopened after being marked as resolved. High reopen rates indicate surface-level fixes or recurring issues that weren’t fully addressed. This often points to quality problems or insufficient root-cause analysis. Reducing reopen rate improves stability and credibility of your support teams.
How to measure: (Number of reopened incidents ÷ total resolved incidents) × 100.
8. Cost per Incident
Average cost incurred for handling a single incident, including labor, tools, downtime, and customer impact. Cost per incident helps organizations understand the economic efficiency of their incident processes and justify investments in automation or tooling. Cost optimization often becomes a major business driver once incident KPIs are measured consistently
How to measure: (Total incident management expenditure) ÷ (number of incidents)
9. Percentage of Major Incidents
The ratio of high-impact or P1 incidents compared to all incidents. Major incidents – those causing widespread or severe impact – deserve special focus due to their business and brand effects. High major incident percentages often prompt reviews of system architecture, risk management, and resilience practices.
How to measure: (Number of major incidents ÷ total incidents) × 100.
10. End-User Satisfaction (CSAT)
Direct feedback from users or customers regarding their satisfaction with incident handling and resolution. Quantitative KPIs are critical, but user experience tells the human side of performance. High CSAT scores correlate with trust in IT and service delivery. Combined with other performance metrics, CSAT gives a balanced scorecard that considers both technical performance and user perception.
How to measure: (User satisfaction survey results aggregated to score percent or average rating).
How to Choose the Right KPIs for Your Organization
Selecting KPIs shouldn’t be arbitrary – it should be aligned with business goals, operational maturity, and customer expectations. Here’s how:
1. Align with Business Objectives
If uptime is critical to revenue (e-commerce, financial services), prioritize metrics like MTTD, MTTR, and uptime percentage. If customer experience matters most, include CSAT and SLA compliance prominently.
2. Balance Strategic, Tactical, and Operational Metrics
Strategic KPIs show long-term health, tactical KPIs reveal process efficiency, and operational KPIs reflect day-to-day performance. A balanced set avoids over-optimization of one area at the expense of others.
3. Avoid Data Overload:
More metrics isn’t better – focus on actionable KPIs that your team can influence. Too much data can obscure signal from noise.
4. Benchmark and Review Periodically
Set targets based on historical performance or industry benchmarks and revisit them quarterly.
Best Practices for Using Incident KPIs Effectively
To ensure KPIs drive improvement:
Define Clear KPI Formulas and Ownership:
Ensure everyone agrees on how each metric is calculated and who owns it.Integrate KPIs into Regular Reviews:
Discuss trends during weekly ops reviews and quarterly business reviews.Use KPIs for Coaching – Not Punishment:
Shared understanding of KPIs fosters continuous learning rather than penalizing teams for indicators out of their control.Automate Data Collection and Reporting:
Manual reporting leads to errors and delays. Automate wherever possible.Act on Insights, Not Just Numbers:
KPIs should trigger questions and actions – if MTTR is increasing, investigate why rather than just presenting the number.
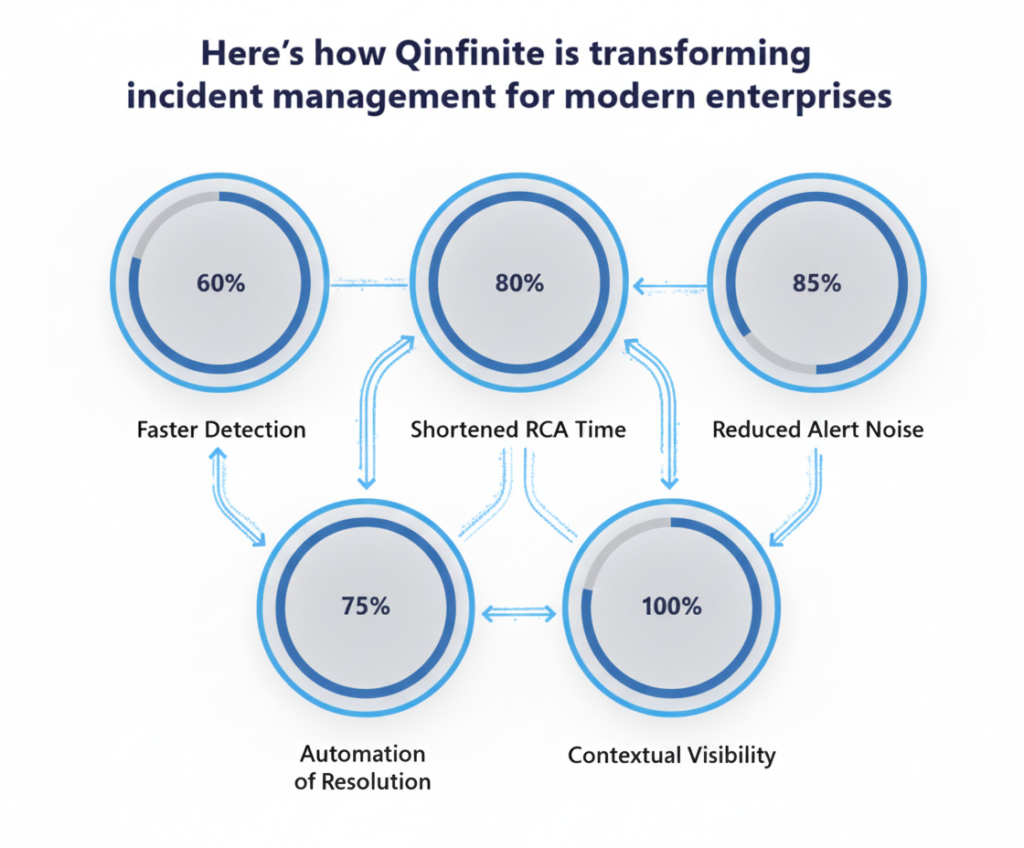
To effectively track and improve incident management KPIs, organizations need more than dashboards and reactive workflows – they need intelligence built into the incident lifecycle itself. This is where Quinnox’s intelligent application management platform, Qinfinite’s intelligent incident management plays a critical role.

- Qinfinite continuously ingests signals from monitoring tools, tickets, and operational data to provide real-time visibility into metrics such as MTTD, MTTA, MTTR, SLA adherence, and incident volume trends.
- Qinfinite’s AI-driven anomaly detection enables faster detection and acknowledgment, directly improving early-response KPIs, while alert correlation and noise reduction ensure teams focus only on high-impact incidents.
- Automated workflows and adaptive playbooks accelerate resolution times and improve first-time resolution rates, while self-learning post-incident insights help reduce reopen rates and recurring major incidents over time.
- By unifying data, teams, and actions within a single intelligent command center, Qinfinite transforms KPI tracking from a passive reporting exercise into an active, predictive capability – one that not only measures performance, but continuously improves reliability, cost efficiency, and end-user satisfaction.
Conclusion
In a world where operational disruptions can cost hundreds of thousands per hour, mastering incident management metrics is no longer optional. KPIs such as MTTD, MTTR, SLA compliance, and CSAT create a data-driven foundation for resilience, efficiency, and customer trust.
However, the real advantage comes from turning these metrics into action. With intelligence embedded across the incident lifecycle, platforms like Qinfinite help organizations move beyond static KPI tracking to continuous optimization – where insights drive faster responses, fewer repeat incidents, and measurable improvements over time. When metrics are consistently applied, reviewed, and operationalized, incident management evolves from reactive recovery to proactive reliability.
Ready to see what intelligent, KPI-driven incident management looks like in practice? Experience how Qinfinite can help your teams predict, prevent, and resolve incidents faster. Schedule a free 120-minute consultation with Qinfinite experts and explore how to elevate your incident management strategy from reactive to resilient.
FAQs on Incident Management Metrics
A metric is any measurable data point, such as an incident count or response time. A KPI (Key Performance Indicator) is a metric that is directly tied to business outcomes and decision-making. In short, all KPIs are metrics, but not all metrics are KPIs. KPIs answer the question: “Is this performance measure critical to achieving our business goals?”
Operational teams typically review their performance on a weekly or bi-weekly basis to identify trends, bottlenecks, and opportunities for immediate improvement, while strategic reviews happen quarterly to assess long-term performance and guide investment and process decisions.
No – relevance depends on organizational priorities. Focus on actionable KPIs aligned with business impact.
End-user satisfaction (CSAT) is the most direct indicator of customer experience, as it reflects how users perceive communication, responsiveness, and resolution quality. When combined with SLA compliance and resolution speed, CSAT provides a well-rounded view of both perceived and actual service performance.
Yes. Automation significantly improves KPI outcomes by accelerating detection, reducing response delays, and eliminating manual handoffs. Automated alerting, routing, and remediation workflows consistently lower MTTD and MTTA, shorten resolution times, and reduce the likelihood of repeat incidents – driving measurable improvements across the incident lifecycle.